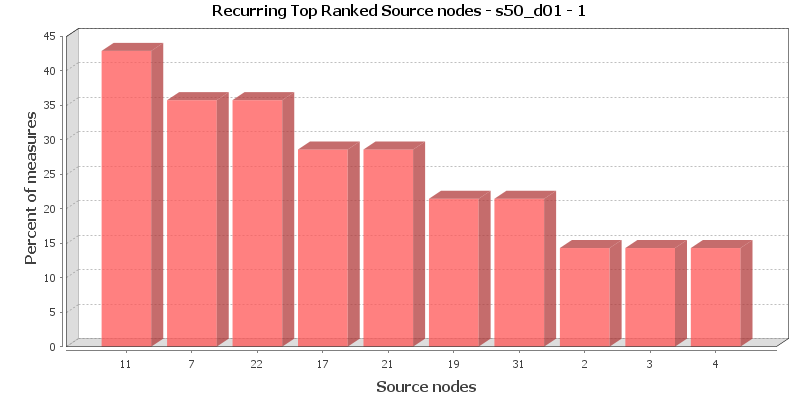
Calculates common social network measures on each selected input network.
Network network
Network Level Measures
Measure Value Row count 50.000 Column count 50.000 Link count 113.000 Density 0.046 Components of 1 node (isolates) 3 Components of 2 nodes (dyadic isolates) 1 Components of 3 or more nodes 4 Reciprocity 0.527 Characteristic path length 3.393 Clustering coefficient 0.396 Network levels (diameter) 8.000 Network fragmentation 0.551 Krackhardt connectedness 0.449 Krackhardt efficiency 0.937 Krackhardt hierarchy 0.617 Krackhardt upperboundedness 0.827 Degree centralization 0.069 Betweenness centralization 0.082 Closeness centralization 0.026 Eigenvector centralization 0.424 Reciprocal (symmetric)? No (52% of the links are reciprocal)
Node Level Measures
Measure Min Max Avg Stddev Total degree centrality 0.000 0.112 0.046 0.024 Total degree centrality [Unscaled] 0.000 11.000 4.520 2.368 In-degree centrality 0.000 0.163 0.046 0.032 In-degree centrality [Unscaled] 0.000 8.000 2.260 1.560 Out-degree centrality 0.000 0.102 0.046 0.024 Out-degree centrality [Unscaled] 0.000 5.000 2.260 1.180 Eigenvector centrality 0.000 0.538 0.131 0.151 Eigenvector centrality [Unscaled] 0.000 0.381 0.092 0.107 Eigenvector centrality per component 0.000 0.251 0.072 0.063 Closeness centrality 0.020 0.041 0.028 0.007 Closeness centrality [Unscaled] 0.000 0.001 0.001 0.000 In-Closeness centrality 0.020 0.052 0.030 0.012 In-Closeness centrality [Unscaled] 0.000 0.001 0.001 0.000 Betweenness centrality 0.000 0.094 0.013 0.022 Betweenness centrality [Unscaled] 0.000 220.000 30.580 51.546 Hub centrality 0.000 0.498 0.135 0.147 Authority centrality 0.000 0.804 0.122 0.159 Information centrality -0.001 0.026 0.020 0.011 Information centrality [Unscaled] -0.000 0.000 0.000 0.000 Clique membership count 0.000 7.000 1.600 1.497 Simmelian ties 0.000 0.041 0.012 0.019 Simmelian ties [Unscaled] 0.000 2.000 0.600 0.917 Clustering coefficient 0.000 1.000 0.396 0.348
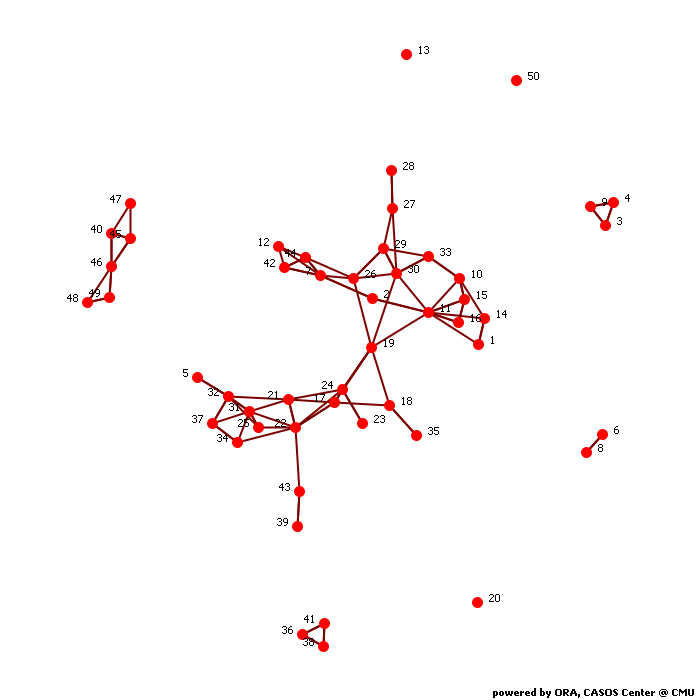
Key Nodes
This chart shows the Source nodes that is repeatedly top-ranked in the measures listed below. The value shown is the percentage of measures for which the Source nodes was ranked in the top three.
Total degree centrality
The Total Degree Centrality of a node is the normalized sum of its row and column degrees. Individuals or organizations who are "in the know" are those who are linked to many others and so, by virtue of their position have access to the ideas, thoughts, beliefs of many others. Individuals who are "in the know" are identified by degree centrality in the relevant social network. Those who are ranked high on this metrics have more connections to others in the same network. The scientific name of this measure is total degree centrality and it is calculated on the agent by agent matrices.
Input network: network (size: 50, density: 0.0461225)
Rank Source nodes Value Unscaled Context* 1 11 0.112 11.000 2.229 2 22 0.092 9.000 1.541 3 7 0.082 8.000 1.197 4 24 0.082 8.000 1.197 5 30 0.082 8.000 1.197 6 31 0.082 8.000 1.197 7 32 0.082 8.000 1.197 8 17 0.071 7.000 0.853 9 19 0.071 7.000 0.853 10 46 0.071 7.000 0.853 * Number of standard deviations from the mean of a random network of the same size and density
Mean: 0.046 Mean in random network: 0.046 Std.dev: 0.024 Std.dev in random network: 0.030 In-degree centrality
The In Degree Centrality of a node is its normalized in-degree. For any node, e.g. an individual or a resource, the in-links are the connections that the node of interest receives from other nodes. For example, imagine an agent by knowledge matrix then the number of in-links a piece of knowledge has is the number of agents that are connected to. The scientific name of this measure is in-degree and it is calculated on the agent by agent matrices.
Input network(s): network
Rank Source nodes Value Unscaled 1 11 0.163 8.000 2 7 0.102 5.000 3 21 0.102 5.000 4 22 0.102 5.000 5 31 0.102 5.000 6 30 0.082 4.000 7 32 0.082 4.000 8 44 0.082 4.000 9 46 0.082 4.000 10 10 0.061 3.000 Out-degree centrality
For any node, e.g. an individual or a resource, the out-links are the connections that the node of interest sends to other nodes. For example, imagine an agent by knowledge matrix then the number of out-links an agent would have is the number of pieces of knowledge it is connected to. The scientific name of this measure is out-degree and it is calculated on the agent by agent matrices. Individuals or organizations who are high in most knowledge have more expertise or are associated with more types of knowledge than are others. If no sub-network connecting agents to knowledge exists, then this measure will not be calculated. The scientific name of this measure is out degree centrality and it is calculated on agent by knowledge matrices. Individuals or organizations who are high in "most resources" have more resources or are associated with more types of resources than are others. If no sub-network connecting agents to resources exists, then this measure will not be calculated. The scientific name of this measure is out degree centrality and it is calculated on agent by resource matrices.
Input network(s): network
Rank Source nodes Value Unscaled 1 17 0.102 5.000 2 24 0.102 5.000 3 19 0.082 4.000 4 22 0.082 4.000 5 30 0.082 4.000 6 32 0.082 4.000 7 7 0.061 3.000 8 10 0.061 3.000 9 11 0.061 3.000 10 12 0.061 3.000 Eigenvector centrality
Calculates the principal eigenvector of the network. A node is central to the extent that its neighbors are central. Leaders of strong cliques are individuals who or organizations who are collected to others that are themselves highly connected to each other. In other words, if you have a clique then the individual most connected to others in the clique and other cliques, is the leader of the clique. Individuals or organizations who are connected to many otherwise isolated individuals or organizations will have a much lower score in this measure then those that are connected to groups that have many connections themselves. The scientific name of this measure is eigenvector centrality and it is calculated on agent by agent matrices.
Input network: network (size: 50, density: 0.0461225)
Rank Source nodes Value Unscaled Context* 1 22 0.538 0.381 0.292 2 21 0.476 0.337 0.065 3 31 0.463 0.327 0.016 4 17 0.440 0.311 -0.070 5 24 0.422 0.298 -0.135 6 19 0.399 0.282 -0.219 7 32 0.332 0.235 -0.464 8 25 0.289 0.205 -0.621 9 30 0.280 0.198 -0.657 10 11 0.278 0.196 -0.664 * Number of standard deviations from the mean of a random network of the same size and density
Mean: 0.131 Mean in random network: 0.459 Std.dev: 0.151 Std.dev in random network: 0.273 Eigenvector centrality per component
Calculates the principal eigenvector of the network. A node is central to the extent that its neighbors are central. Each component is extracted as a separate network, Eigenvector Centrality is computed on it and scaled according to the component size. The scores are then combined into a single result vector.
Input network(s): network
Rank Source nodes Value 1 22 0.251 2 21 0.222 3 31 0.216 4 17 0.205 5 24 0.197 6 19 0.186 7 32 0.155 8 25 0.135 9 30 0.131 10 11 0.130 Closeness centrality
The average closeness of a node to the other nodes in a network (also called out-closeness). Loosely, Closeness is the inverse of the average distance in the network from the node to all other nodes.
Input network: network (size: 50, density: 0.0461225)
Rank Source nodes Value Unscaled Context* 1 43 0.041 0.001 -3.103 2 39 0.040 0.001 -3.133 3 17 0.039 0.001 -3.172 4 19 0.039 0.001 -3.173 5 24 0.039 0.001 -3.173 6 22 0.039 0.001 -3.184 7 18 0.038 0.001 -3.192 8 23 0.038 0.001 -3.198 9 25 0.038 0.001 -3.201 10 21 0.038 0.001 -3.208 * Number of standard deviations from the mean of a random network of the same size and density
Mean: 0.028 Mean in random network: 0.131 Std.dev: 0.007 Std.dev in random network: 0.029 In-Closeness centrality
The average closeness of a node from the other nodes in a network. Loosely, Closeness is the inverse of the average distance in the network to the node and from all other nodes.
Input network(s): network
Rank Source nodes Value Unscaled 1 11 0.052 0.001 2 2 0.051 0.001 3 7 0.051 0.001 4 15 0.051 0.001 5 30 0.051 0.001 6 44 0.051 0.001 7 16 0.050 0.001 8 33 0.050 0.001 9 26 0.050 0.001 10 10 0.050 0.001 Betweenness centrality
The Betweenness Centrality of node v in a network is defined as: across all node pairs that have a shortest path containing v, the percentage that pass through v. Individuals or organizations that are potentially influential are positioned to broker connections between groups and to bring to bear the influence of one group on another or serve as a gatekeeper between groups. This agent occurs on many of the shortest paths between other agents. The scientific name of this measure is betweenness centrality and it is calculated on agent by agent matrices.
Input network: network (size: 50, density: 0.0461225)
Rank Source nodes Value Unscaled Context* 1 22 0.094 220.000 0.181 2 19 0.086 202.000 0.149 3 17 0.075 176.000 0.103 4 11 0.055 128.833 0.020 5 30 0.034 79.167 -0.069 6 26 0.031 72.000 -0.081 7 21 0.030 70.000 -0.085 8 31 0.029 68.500 -0.087 9 24 0.028 67.000 -0.090 10 7 0.023 54.333 -0.113 * Number of standard deviations from the mean of a random network of the same size and density
Mean: 0.013 Mean in random network: 0.050 Std.dev: 0.022 Std.dev in random network: 0.240 Hub centrality
A node is hub-central to the extent that its out-links are to nodes that have many in-links. Individuals or organizations that act as hubs are sending information to a wide range of others each of whom has many others reporting to them. Technically, an agent is hub-central if its out-links are to agents that have many other agents sending links to them. The scientific name of this measure is hub centrality and it is calculated on agent by agent matrices.
Input network(s): network
Rank Source nodes Value 1 19 0.498 2 30 0.488 3 17 0.425 4 24 0.397 5 10 0.384 6 15 0.327 7 22 0.326 8 14 0.317 9 16 0.291 10 2 0.287 Authority centrality
A node is authority-central to the extent that its in-links are from nodes that have many out-links. Individuals or organizations that act as authorities are receiving information from a wide range of others each of whom sends information to a large number of others. Technically, an agent is authority-central if its in-links are from agents that have are sending links to many others. The scientific name of this measure is authority centrality and it is calculated on agent by agent matrices.
Input network(s): network
Rank Source nodes Value 1 11 0.804 2 21 0.463 3 22 0.367 4 26 0.359 5 31 0.336 6 33 0.327 7 30 0.312 8 24 0.284 9 19 0.255 10 29 0.231 Information centrality
Calculate the Stephenson and Zelen information centrality measure for each node.
Input network(s): network
Rank Source nodes Value Unscaled 1 2 0.026 0.000 2 7 0.026 0.000 3 11 0.026 0.000 4 19 0.026 0.000 5 30 0.026 0.000 6 26 0.026 0.000 7 15 0.026 0.000 8 10 0.026 0.000 9 12 0.026 0.000 10 17 0.026 0.000 Clique membership count
The number of distinct cliques to which each node belongs. Individuals or organizations who are high in number of cliques are those that belong to a large number of distinct cliques. A clique is defined as a group of three or more actors that have many connections to each other and relatively fewer connections to those in other groups. The scientific name of this measure is clique count and it is calculated on the agent by agent matrices.
Input network(s): network
Rank Source nodes Value 1 31 7.000 2 11 5.000 3 30 5.000 4 19 4.000 5 22 4.000 6 17 3.000 7 21 3.000 8 26 3.000 9 29 3.000 10 32 3.000 Simmelian ties
The normalized number of Simmelian ties of each node.
Input network(s): network
Rank Source nodes Value Unscaled 1 3 0.041 2.000 2 4 0.041 2.000 3 7 0.041 2.000 4 9 0.041 2.000 5 11 0.041 2.000 6 15 0.041 2.000 7 16 0.041 2.000 8 36 0.041 2.000 9 38 0.041 2.000 10 40 0.041 2.000 Clustering coefficient
Measures the degree of clustering in a network by averaging the clustering coefficient of each node, which is defined as the density of the node's ego network.
Input network(s): network
Rank Source nodes Value 1 3 1.000 2 4 1.000 3 9 1.000 4 12 1.000 5 16 1.000 6 36 1.000 7 38 1.000 8 41 1.000 9 47 1.000 10 48 1.000
Key Nodes Table
This shows the top scoring nodes side-by-side for selected measures.
Rank Betweenness centrality Closeness centrality Eigenvector centrality Eigenvector centrality per component In-degree centrality In-Closeness centrality Out-degree centrality Total degree centrality 1 22 43 22 22 11 11 17 11 2 19 39 21 21 7 2 24 22 3 17 17 31 31 21 7 19 7 4 11 19 17 17 22 15 22 24 5 30 24 24 24 31 30 30 30 6 26 22 19 19 30 44 32 31 7 21 18 32 32 32 16 7 32 8 31 23 25 25 44 33 10 17 9 24 25 30 30 46 26 11 19 10 7 21 11 11 10 10 12 46