Calculates common social network measures on each selected input network.
Network network
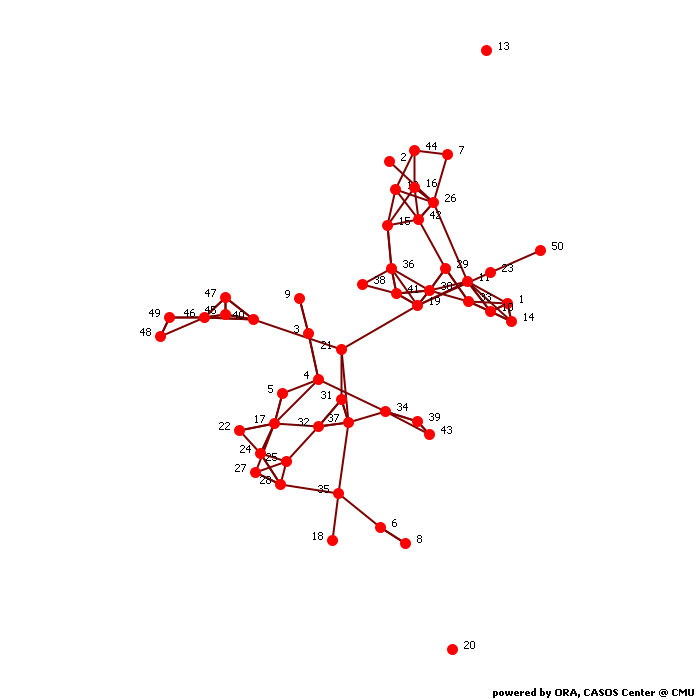
Network Level Measures
Measure Value Row count 50.000 Column count 50.000 Link count 116.000 Density 0.047 Components of 1 node (isolates) 2 Components of 2 nodes (dyadic isolates) 0 Components of 3 or more nodes 1 Reciprocity 0.432 Characteristic path length 4.490 Clustering coefficient 0.310 Network levels (diameter) 13.000 Network fragmentation 0.079 Krackhardt connectedness 0.921 Krackhardt efficiency 0.969 Krackhardt hierarchy 0.740 Krackhardt upperboundedness 0.867 Degree centralization 0.046 Betweenness centralization 0.123 Closeness centralization 0.092 Eigenvector centralization 0.420 Reciprocal (symmetric)? No (43% of the links are reciprocal)
Node Level Measures
Measure Min Max Avg Stddev Total degree centrality 0.000 0.092 0.047 0.024 Total degree centrality [Unscaled] 0.000 9.000 4.640 2.330 In-degree centrality 0.000 0.122 0.047 0.031 In-degree centrality [Unscaled] 0.000 6.000 2.320 1.529 Out-degree centrality 0.000 0.102 0.047 0.026 Out-degree centrality [Unscaled] 0.000 5.000 2.320 1.272 Eigenvector centrality 0.000 0.530 0.127 0.155 Eigenvector centrality [Unscaled] 0.000 0.375 0.090 0.109 Eigenvector centrality per component 0.000 0.360 0.086 0.105 Closeness centrality 0.020 0.082 0.038 0.022 Closeness centrality [Unscaled] 0.000 0.002 0.001 0.000 In-Closeness centrality 0.020 0.051 0.033 0.011 In-Closeness centrality [Unscaled] 0.000 0.001 0.001 0.000 Betweenness centrality 0.000 0.147 0.026 0.038 Betweenness centrality [Unscaled] 0.000 346.000 61.560 90.013 Hub centrality 0.000 0.707 0.115 0.164 Authority centrality 0.000 0.757 0.104 0.171 Clique membership count 0.000 4.000 1.200 0.917 Simmelian ties 0.000 0.061 0.012 0.021 Simmelian ties [Unscaled] 0.000 3.000 0.600 1.039 Clustering coefficient 0.000 1.000 0.310 0.316
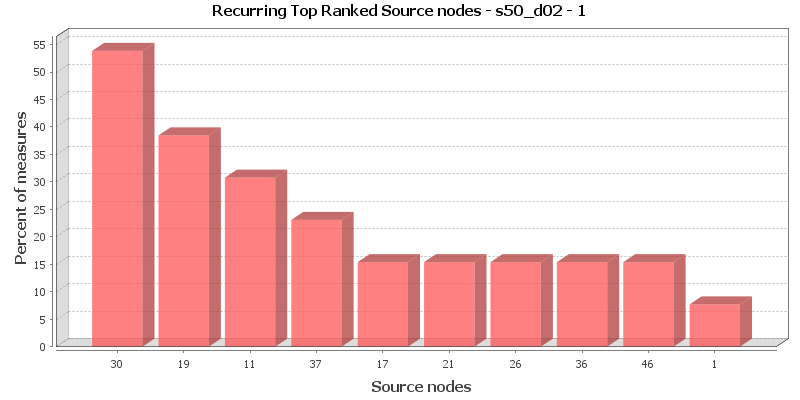
Key Nodes
This chart shows the Source nodes that is repeatedly top-ranked in the measures listed below. The value shown is the percentage of measures for which the Source nodes was ranked in the top three.
Total degree centrality
The Total Degree Centrality of a node is the normalized sum of its row and column degrees. Individuals or organizations who are "in the know" are those who are linked to many others and so, by virtue of their position have access to the ideas, thoughts, beliefs of many others. Individuals who are "in the know" are identified by degree centrality in the relevant social network. Those who are ranked high on this metrics have more connections to others in the same network. The scientific name of this measure is total degree centrality and it is calculated on the agent by agent matrices.
Input network: network (size: 50, density: 0.0473469)
Rank Source nodes Value Unscaled Context* 1 17 0.092 9.000 1.481 2 30 0.092 9.000 1.481 3 46 0.092 9.000 1.481 4 10 0.082 8.000 1.142 5 19 0.082 8.000 1.142 6 26 0.082 8.000 1.142 7 11 0.071 7.000 0.802 8 36 0.071 7.000 0.802 9 37 0.071 7.000 0.802 10 40 0.071 7.000 0.802 * Number of standard deviations from the mean of a random network of the same size and density
Mean: 0.047 Mean in random network: 0.047 Std.dev: 0.024 Std.dev in random network: 0.030 In-degree centrality
The In Degree Centrality of a node is its normalized in-degree. For any node, e.g. an individual or a resource, the in-links are the connections that the node of interest receives from other nodes. For example, imagine an agent by knowledge matrix then the number of in-links a piece of knowledge has is the number of agents that are connected to. The scientific name of this measure is in-degree and it is calculated on the agent by agent matrices.
Input network(s): network
Rank Source nodes Value Unscaled 1 30 0.122 6.000 2 19 0.102 5.000 3 26 0.102 5.000 4 46 0.102 5.000 5 4 0.082 4.000 6 10 0.082 4.000 7 15 0.082 4.000 8 17 0.082 4.000 9 28 0.082 4.000 10 32 0.082 4.000 Out-degree centrality
For any node, e.g. an individual or a resource, the out-links are the connections that the node of interest sends to other nodes. For example, imagine an agent by knowledge matrix then the number of out-links an agent would have is the number of pieces of knowledge it is connected to. The scientific name of this measure is out-degree and it is calculated on the agent by agent matrices. Individuals or organizations who are high in most knowledge have more expertise or are associated with more types of knowledge than are others. If no sub-network connecting agents to knowledge exists, then this measure will not be calculated. The scientific name of this measure is out degree centrality and it is calculated on agent by knowledge matrices. Individuals or organizations who are high in "most resources" have more resources or are associated with more types of resources than are others. If no sub-network connecting agents to resources exists, then this measure will not be calculated. The scientific name of this measure is out degree centrality and it is calculated on agent by resource matrices.
Input network(s): network
Rank Source nodes Value Unscaled 1 11 0.102 5.000 2 17 0.102 5.000 3 37 0.102 5.000 4 10 0.082 4.000 5 12 0.082 4.000 6 25 0.082 4.000 7 36 0.082 4.000 8 46 0.082 4.000 9 1 0.061 3.000 10 14 0.061 3.000 Eigenvector centrality
Calculates the principal eigenvector of the network. A node is central to the extent that its neighbors are central. Leaders of strong cliques are individuals who or organizations who are collected to others that are themselves highly connected to each other. In other words, if you have a clique then the individual most connected to others in the clique and other cliques, is the leader of the clique. Individuals or organizations who are connected to many otherwise isolated individuals or organizations will have a much lower score in this measure then those that are connected to groups that have many connections themselves. The scientific name of this measure is eigenvector centrality and it is calculated on agent by agent matrices.
Input network: network (size: 50, density: 0.0473469)
Rank Source nodes Value Unscaled Context* 1 30 0.530 0.375 0.399 2 11 0.508 0.359 0.317 3 19 0.468 0.331 0.170 4 36 0.409 0.289 -0.050 5 41 0.359 0.254 -0.233 6 26 0.331 0.234 -0.336 7 33 0.326 0.231 -0.355 8 1 0.322 0.228 -0.371 9 10 0.322 0.228 -0.371 10 42 0.302 0.214 -0.444 * Number of standard deviations from the mean of a random network of the same size and density
Mean: 0.127 Mean in random network: 0.422 Std.dev: 0.155 Std.dev in random network: 0.270 Eigenvector centrality per component
Calculates the principal eigenvector of the network. A node is central to the extent that its neighbors are central. Each component is extracted as a separate network, Eigenvector Centrality is computed on it and scaled according to the component size. The scores are then combined into a single result vector.
Input network(s): network
Rank Source nodes Value 1 30 0.360 2 11 0.345 3 19 0.318 4 36 0.277 5 41 0.244 6 26 0.225 7 33 0.222 8 1 0.219 9 10 0.219 10 42 0.205 Closeness centrality
The average closeness of a node to the other nodes in a network (also called out-closeness). Loosely, Closeness is the inverse of the average distance in the network from the node to all other nodes.
Input network: network (size: 50, density: 0.0473469)
Rank Source nodes Value Unscaled Context* 1 37 0.082 0.002 -2.241 2 25 0.082 0.002 -2.255 3 21 0.081 0.002 -2.286 4 31 0.078 0.002 -2.405 5 32 0.078 0.002 -2.405 6 17 0.077 0.002 -2.433 7 24 0.073 0.001 -2.561 8 27 0.073 0.001 -2.564 9 5 0.073 0.001 -2.568 10 22 0.072 0.001 -2.578 * Number of standard deviations from the mean of a random network of the same size and density
Mean: 0.038 Mean in random network: 0.150 Std.dev: 0.022 Std.dev in random network: 0.030 In-Closeness centrality
The average closeness of a node from the other nodes in a network. Loosely, Closeness is the inverse of the average distance in the network to the node and from all other nodes.
Input network(s): network
Rank Source nodes Value Unscaled 1 19 0.051 0.001 2 30 0.051 0.001 3 36 0.051 0.001 4 41 0.051 0.001 5 15 0.050 0.001 6 29 0.049 0.001 7 7 0.049 0.001 8 42 0.049 0.001 9 38 0.049 0.001 10 26 0.048 0.001 Betweenness centrality
The Betweenness Centrality of node v in a network is defined as: across all node pairs that have a shortest path containing v, the percentage that pass through v. Individuals or organizations that are potentially influential are positioned to broker connections between groups and to bring to bear the influence of one group on another or serve as a gatekeeper between groups. This agent occurs on many of the shortest paths between other agents. The scientific name of this measure is betweenness centrality and it is calculated on agent by agent matrices.
Input network: network (size: 50, density: 0.0473469)
Rank Source nodes Value Unscaled Context* 1 37 0.147 346.000 0.394 2 32 0.116 273.000 0.269 3 21 0.112 264.000 0.253 4 17 0.110 258.500 0.244 5 30 0.107 252.667 0.234 6 19 0.101 237.750 0.208 7 29 0.096 225.583 0.187 8 33 0.052 121.583 0.009 9 36 0.050 117.583 0.002 10 28 0.042 98.500 -0.031 * Number of standard deviations from the mean of a random network of the same size and density
Mean: 0.026 Mean in random network: 0.050 Std.dev: 0.038 Std.dev in random network: 0.247 Hub centrality
A node is hub-central to the extent that its out-links are to nodes that have many in-links. Individuals or organizations that act as hubs are sending information to a wide range of others each of whom has many others reporting to them. Technically, an agent is hub-central if its out-links are to agents that have many other agents sending links to them. The scientific name of this measure is hub centrality and it is calculated on agent by agent matrices.
Input network(s): network
Rank Source nodes Value 1 11 0.707 2 36 0.455 3 41 0.412 4 33 0.387 5 12 0.385 6 29 0.373 7 19 0.372 8 16 0.355 9 30 0.280 10 42 0.258 Authority centrality
A node is authority-central to the extent that its in-links are from nodes that have many out-links. Individuals or organizations that act as authorities are receiving information from a wide range of others each of whom sends information to a large number of others. Technically, an agent is authority-central if its in-links are from agents that have are sending links to many others. The scientific name of this measure is authority centrality and it is calculated on agent by agent matrices.
Input network(s): network
Rank Source nodes Value 1 30 0.757 2 26 0.517 3 19 0.478 4 10 0.440 5 15 0.407 6 42 0.344 7 41 0.336 8 1 0.334 9 36 0.238 10 33 0.232 Clique membership count
The number of distinct cliques to which each node belongs. Individuals or organizations who are high in number of cliques are those that belong to a large number of distinct cliques. A clique is defined as a group of three or more actors that have many connections to each other and relatively fewer connections to those in other groups. The scientific name of this measure is clique count and it is calculated on the agent by agent matrices.
Input network(s): network
Rank Source nodes Value 1 42 4.000 2 30 3.000 3 1 2.000 4 10 2.000 5 11 2.000 6 12 2.000 7 15 2.000 8 16 2.000 9 17 2.000 10 19 2.000 Simmelian ties
The normalized number of Simmelian ties of each node.
Input network(s): network
Rank Source nodes Value Unscaled 1 40 0.061 3.000 2 45 0.061 3.000 3 46 0.061 3.000 4 47 0.061 3.000 5 1 0.041 2.000 6 10 0.041 2.000 7 14 0.041 2.000 8 19 0.041 2.000 9 30 0.041 2.000 10 31 0.041 2.000 Clustering coefficient
Measures the degree of clustering in a network by averaging the clustering coefficient of each node, which is defined as the density of the node's ego network.
Input network(s): network
Rank Source nodes Value 1 22 1.000 2 38 1.000 3 43 1.000 4 45 1.000 5 47 1.000 6 48 1.000 7 14 0.833 8 1 0.583 9 5 0.500 10 31 0.500
Key Nodes Table
This shows the top scoring nodes side-by-side for selected measures.
Rank Betweenness centrality Closeness centrality Eigenvector centrality Eigenvector centrality per component In-degree centrality In-Closeness centrality Out-degree centrality Total degree centrality 1 37 37 30 30 30 19 11 17 2 32 25 11 11 19 30 17 30 3 21 21 19 19 26 36 37 46 4 17 31 36 36 46 41 10 10 5 30 32 41 41 4 15 12 19 6 19 17 26 26 10 29 25 26 7 29 24 33 33 15 7 36 11 8 33 27 1 1 17 42 46 36 9 36 5 10 10 28 38 1 37 10 28 22 42 42 32 26 14 40