Calculates common social network measures on each selected input network.
Network knowledge x knowledge
Block Model - Newman's Clustering Algorithm
Network Level Measures
Measure Value Row count 22963.000 Column count 22963.000 Link count 48436.000 Density 0.000 Components of 1 node (isolates) 0 Components of 2 nodes (dyadic isolates) 0 Components of 3 or more nodes 1 Reciprocity 1.000 Characteristic path length 3.842 Clustering coefficient 0.230 Network levels (diameter) 11.000 Network fragmentation 0.000 Krackhardt connectedness 1.000 Krackhardt efficiency 1.000 Krackhardt hierarchy 0.000 Krackhardt upperboundedness 1.000 Degree centralization 0.104 Betweenness centralization 0.145 Closeness centralization 0.324 Eigenvector centralization 0.342 Reciprocal (symmetric)? Yes
Node Level Measures
Measure Min Max Avg Stddev Total degree centrality 0.000 0.104 0.000 0.001 Total degree centrality [Unscaled] 1.000 2390.000 4.219 32.942 In-degree centrality 0.000 0.104 0.000 0.001 In-degree centrality [Unscaled] 1.000 2390.000 4.219 32.942 Out-degree centrality 0.000 0.104 0.000 0.001 Out-degree centrality [Unscaled] 1.000 2390.000 4.219 32.942 Eigenvector centrality 0.000 0.346 0.003 0.009 Eigenvector centrality [Unscaled] 0.000 0.244 0.002 0.006 Eigenvector centrality per component 0.000 0.244 0.002 0.006 Closeness centrality 0.137 0.427 0.265 0.035 Closeness centrality [Unscaled] 0.000 0.000 0.000 0.000 In-Closeness centrality -1894847104.000 179.391 -4487504.132 66956457.538 In-Closeness centrality [Unscaled] -82521.000 0.008 -195.432 2915.968 Betweenness centrality 0.000 0.145 0.000 0.002 Betweenness centrality [Unscaled] 0.000 38143864.000 32633.903 580115.167 Hub centrality 0.000 0.346 0.003 0.009 Authority centrality 0.000 0.346 0.003 0.009 Clique membership count 0.000 4609.000 3.629 73.083 Simmelian ties 0.000 0.075 0.000 0.001 Simmelian ties [Unscaled] 0.000 1719.000 2.105 23.898 Clustering coefficient 0.000 1.000 0.230 0.389
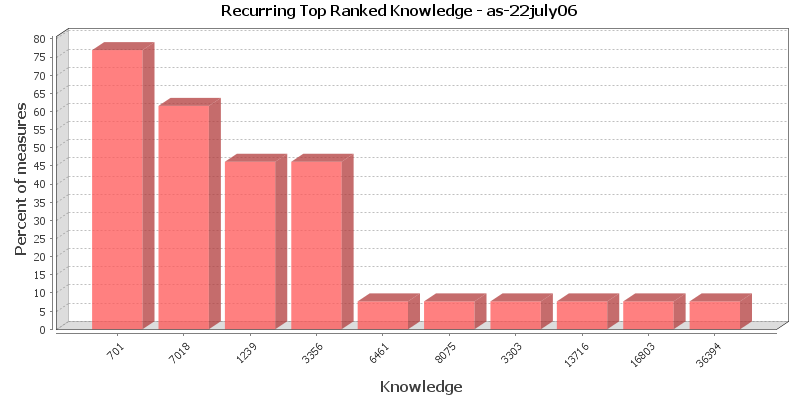
Key Nodes
This chart shows the Knowledge that is repeatedly top-ranked in the measures listed below. The value shown is the percentage of measures for which the Knowledge was ranked in the top three.
Total degree centrality
The Total Degree Centrality of a node is the normalized sum of its row and column degrees. Individuals or organizations who are "in the know" are those who are linked to many others and so, by virtue of their position have access to the ideas, thoughts, beliefs of many others. Individuals who are "in the know" are identified by degree centrality in the relevant social network. Those who are ranked high on this metrics have more connections to others in the same network. The scientific name of this measure is total degree centrality and it is calculated on the agent by agent matrices.
Input network: knowledge x knowledge (size: 22963, density: 0.000183721)
Rank Knowledge Value Unscaled Context* 1 701 0.104 2390.000 1161.703 2 7018 0.088 2016.000 979.592 3 1239 0.075 1713.000 832.053 4 3356 0.057 1298.000 629.978 5 174 0.054 1243.000 603.197 6 209 0.053 1210.000 587.128 7 3549 0.033 764.000 369.959 8 4323 0.033 755.000 365.576 9 6461 0.030 697.000 337.334 10 7132 0.029 658.000 318.344 * Number of standard deviations from the mean of a random network of the same size and density
Mean: 0.000 Mean in random network: 0.000 Std.dev: 0.001 Std.dev in random network: 0.000 In-degree centrality
The In Degree Centrality of a node is its normalized in-degree. For any node, e.g. an individual or a resource, the in-links are the connections that the node of interest receives from other nodes. For example, imagine an agent by knowledge matrix then the number of in-links a piece of knowledge has is the number of agents that are connected to. The scientific name of this measure is in-degree and it is calculated on the agent by agent matrices.
Input network(s): knowledge x knowledge
Rank Knowledge Value Unscaled 1 701 0.104 2390.000 2 7018 0.088 2016.000 3 1239 0.075 1713.000 4 3356 0.057 1298.000 5 174 0.054 1243.000 6 209 0.053 1210.000 7 3549 0.033 764.000 8 4323 0.033 755.000 9 6461 0.030 697.000 10 7132 0.029 658.000 Out-degree centrality
For any node, e.g. an individual or a resource, the out-links are the connections that the node of interest sends to other nodes. For example, imagine an agent by knowledge matrix then the number of out-links an agent would have is the number of pieces of knowledge it is connected to. The scientific name of this measure is out-degree and it is calculated on the agent by agent matrices. Individuals or organizations who are high in most knowledge have more expertise or are associated with more types of knowledge than are others. If no sub-network connecting agents to knowledge exists, then this measure will not be calculated. The scientific name of this measure is out degree centrality and it is calculated on agent by knowledge matrices. Individuals or organizations who are high in "most resources" have more resources or are associated with more types of resources than are others. If no sub-network connecting agents to resources exists, then this measure will not be calculated. The scientific name of this measure is out degree centrality and it is calculated on agent by resource matrices.
Input network(s): knowledge x knowledge
Rank Knowledge Value Unscaled 1 701 0.104 2390.000 2 7018 0.088 2016.000 3 1239 0.075 1713.000 4 3356 0.057 1298.000 5 174 0.054 1243.000 6 209 0.053 1210.000 7 3549 0.033 764.000 8 4323 0.033 755.000 9 6461 0.030 697.000 10 7132 0.029 658.000 Eigenvector centrality
Calculates the principal eigenvector of the network. A node is central to the extent that its neighbors are central. Leaders of strong cliques are individuals who or organizations who are collected to others that are themselves highly connected to each other. In other words, if you have a clique then the individual most connected to others in the clique and other cliques, is the leader of the clique. Individuals or organizations who are connected to many otherwise isolated individuals or organizations will have a much lower score in this measure then those that are connected to groups that have many connections themselves. The scientific name of this measure is eigenvector centrality and it is calculated on agent by agent matrices.
Input network: knowledge x knowledge (size: 22963, density: 0.000183721)
Rank Knowledge Value Unscaled Context* 1 701 0.346 0.244 9.064 2 3356 0.279 0.197 9.168 3 7018 0.276 0.195 9.171 4 1239 0.272 0.192 9.179 5 6461 0.250 0.177 9.212 6 3303 0.249 0.176 9.215 7 4513 0.234 0.166 9.237 8 6939 0.225 0.159 9.252 9 174 0.209 0.148 9.277 10 3549 0.184 0.130 9.316 * Number of standard deviations from the mean of a random network of the same size and density
Mean: 0.003 Mean in random network: 6.166 Std.dev: 0.009 Std.dev in random network: -0.642 Eigenvector centrality per component
Calculates the principal eigenvector of the network. A node is central to the extent that its neighbors are central. Each component is extracted as a separate network, Eigenvector Centrality is computed on it and scaled according to the component size. The scores are then combined into a single result vector.
Input network(s): knowledge x knowledge
Rank Knowledge Value 1 701 0.244 2 3356 0.197 3 7018 0.195 4 1239 0.192 5 6461 0.177 6 3303 0.176 7 4513 0.166 8 6939 0.159 9 174 0.148 10 3549 0.130 Closeness centrality
The average closeness of a node to the other nodes in a network (also called out-closeness). Loosely, Closeness is the inverse of the average distance in the network from the node to all other nodes.
Input network: knowledge x knowledge (size: 22963, density: 0.000183721)
Rank Knowledge Value Unscaled Context* 1 3356 0.427 0.000 -1.056 2 1239 0.421 0.000 -1.057 3 701 0.414 0.000 -1.057 4 6461 0.411 0.000 -1.057 5 3549 0.410 0.000 -1.057 6 3303 0.410 0.000 -1.057 7 1299 0.408 0.000 -1.057 8 7018 0.407 0.000 -1.057 9 2914 0.403 0.000 -1.057 10 174 0.403 0.000 -1.057 * Number of standard deviations from the mean of a random network of the same size and density
Mean: 0.265 Mean in random network: 57.117 Std.dev: 0.035 Std.dev in random network: 53.663 In-Closeness centrality
The average closeness of a node from the other nodes in a network. Loosely, Closeness is the inverse of the average distance in the network to the node and from all other nodes.
Input network(s): knowledge x knowledge
Rank Knowledge Value Unscaled 1 4181 179.391 0.008 2 101 105.816 0.005 3 7738 103.900 0.005 4 16524 69.372 0.003 5 12885 63.431 0.003 6 12179 57.405 0.002 7 16334 43.406 0.002 8 13184 24.145 0.001 9 12968 23.844 0.001 10 3573 23.746 0.001 Betweenness centrality
The Betweenness Centrality of node v in a network is defined as: across all node pairs that have a shortest path containing v, the percentage that pass through v. Individuals or organizations that are potentially influential are positioned to broker connections between groups and to bring to bear the influence of one group on another or serve as a gatekeeper between groups. This agent occurs on many of the shortest paths between other agents. The scientific name of this measure is betweenness centrality and it is calculated on agent by agent matrices.
Input network: knowledge x knowledge (size: 22963, density: 0.000183721)
Rank Knowledge Value Unscaled Context* 1 701 0.145 38143864.000 0.012 2 1239 0.132 34826608.000 0.011 3 3356 0.125 32881144.000 0.010 4 7018 0.112 29445384.000 0.009 5 174 0.080 21141252.000 0.007 6 1299 0.078 20671406.000 0.006 7 209 0.069 18157456.000 0.006 8 3549 0.067 17727112.000 0.006 9 702 0.046 12129121.000 0.004 10 4323 0.039 10332049.000 0.003 * Number of standard deviations from the mean of a random network of the same size and density
Mean: 0.000 Mean in random network: -0.002 Std.dev: 0.002 Std.dev in random network: 12.363 Hub centrality
A node is hub-central to the extent that its out-links are to nodes that have many in-links. Individuals or organizations that act as hubs are sending information to a wide range of others each of whom has many others reporting to them. Technically, an agent is hub-central if its out-links are to agents that have many other agents sending links to them. The scientific name of this measure is hub centrality and it is calculated on agent by agent matrices.
Input network(s): knowledge x knowledge
Rank Knowledge Value 1 701 0.346 2 3356 0.279 3 7018 0.276 4 1239 0.272 5 6461 0.250 6 3303 0.249 7 4513 0.234 8 6939 0.225 9 174 0.209 10 3549 0.184 Authority centrality
A node is authority-central to the extent that its in-links are from nodes that have many out-links. Individuals or organizations that act as authorities are receiving information from a wide range of others each of whom sends information to a large number of others. Technically, an agent is authority-central if its in-links are from agents that have are sending links to many others. The scientific name of this measure is authority centrality and it is calculated on agent by agent matrices.
Input network(s): knowledge x knowledge
Rank Knowledge Value 1 701 0.346 2 3356 0.279 3 7018 0.276 4 1239 0.272 5 6461 0.250 6 3303 0.249 7 4513 0.234 8 6939 0.225 9 174 0.209 10 3549 0.184 Clique membership count
The number of distinct cliques to which each node belongs. Individuals or organizations who are high in number of cliques are those that belong to a large number of distinct cliques. A clique is defined as a group of three or more actors that have many connections to each other and relatively fewer connections to those in other groups. The scientific name of this measure is clique count and it is calculated on the agent by agent matrices.
Input network(s): knowledge x knowledge
Rank Knowledge Value 1 6461 4609.000 2 3303 4436.000 3 8075 2729.000 4 3356 2682.000 5 4513 2681.000 6 701 2296.000 7 1239 2112.000 8 7018 1899.000 9 6939 1820.000 10 3491 1820.000 Simmelian ties
The normalized number of Simmelian ties of each node.
Input network(s): knowledge x knowledge
Rank Knowledge Value Unscaled 1 701 0.075 1719.000 2 7018 0.065 1484.000 3 1239 0.053 1218.000 4 3356 0.047 1080.000 5 209 0.034 780.000 6 174 0.034 771.000 7 6461 0.027 619.000 8 3549 0.027 615.000 9 3303 0.025 577.000 10 6939 0.022 498.000 Clustering coefficient
Measures the degree of clustering in a network by averaging the clustering coefficient of each node, which is defined as the density of the node's ego network.
Input network(s): knowledge x knowledge
Rank Knowledge Value 1 13716 1.000 2 16803 1.000 3 36394 1.000 4 14757 1.000 5 36431 1.000 6 15170 1.000 7 14627 1.000 8 15162 1.000 9 13546 1.000 10 13989 1.000
Key Nodes Table
This shows the top scoring nodes side-by-side for selected measures.
Rank Betweenness centrality Closeness centrality Eigenvector centrality Eigenvector centrality per component In-degree centrality In-Closeness centrality Out-degree centrality Total degree centrality 1 701 3356 701 701 701 4181 701 701 2 1239 1239 3356 3356 7018 101 7018 7018 3 3356 701 7018 7018 1239 7738 1239 1239 4 7018 6461 1239 1239 3356 16524 3356 3356 5 174 3549 6461 6461 174 12885 174 174 6 1299 3303 3303 3303 209 12179 209 209 7 209 1299 4513 4513 3549 16334 3549 3549 8 3549 7018 6939 6939 4323 13184 4323 4323 9 702 2914 174 174 6461 12968 6461 6461 10 4323 174 3549 3549 7132 3573 7132 7132