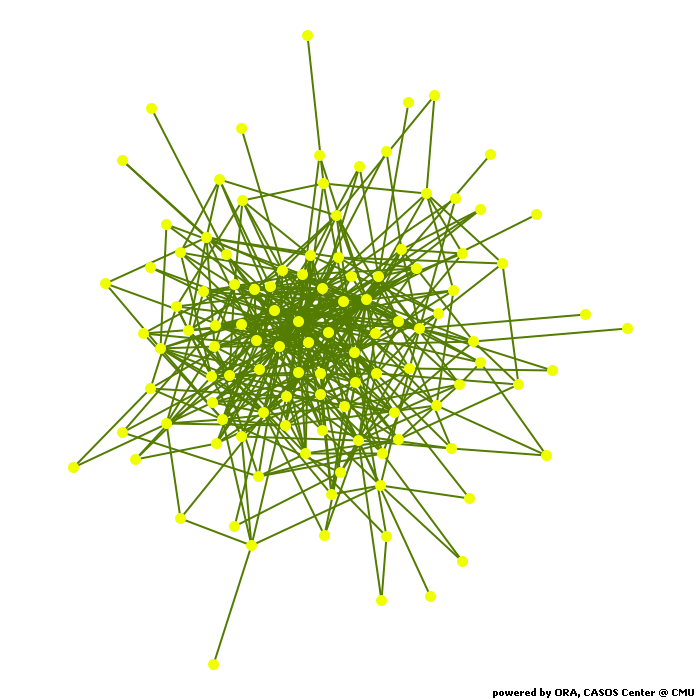
Calculates common social network measures on each selected input network.
Network concept x concept
Network Level Measures
Measure Value Row count 112.000 Column count 112.000 Link count 425.000 Density 0.034 Components of 1 node (isolates) 0 Components of 2 nodes (dyadic isolates) 0 Components of 3 or more nodes 1 Reciprocity 0.000 Characteristic path length 2.599 Clustering coefficient 0.086 Network levels (diameter) 7.000 Network fragmentation 0.000 Krackhardt connectedness 1.000 Krackhardt efficiency 0.949 Krackhardt hierarchy 1.000 Krackhardt upperboundedness 0.706 Degree centralization 0.190 Betweenness centralization 0.042 Closeness centralization 0.030 Eigenvector centralization 0.474 Reciprocal (symmetric)? No (0% of the links are reciprocal)
Node Level Measures
Measure Min Max Avg Stddev Total degree centrality 0.005 0.221 0.034 0.031 Total degree centrality [Unscaled] 1.000 49.000 7.589 6.851 In-degree centrality 0.000 0.360 0.034 0.049 In-degree centrality [Unscaled] 0.000 40.000 3.795 5.445 Out-degree centrality 0.000 0.180 0.034 0.031 Out-degree centrality [Unscaled] 0.000 20.000 3.795 3.423 Eigenvector centrality 0.002 0.567 0.102 0.086 Eigenvector centrality [Unscaled] 0.002 0.401 0.072 0.061 Eigenvector centrality per component 0.002 0.401 0.072 0.061 Closeness centrality 0.009 0.028 0.013 0.004 Closeness centrality [Unscaled] 0.000 0.000 0.000 0.000 In-Closeness centrality 0.009 0.105 0.017 0.016 In-Closeness centrality [Unscaled] 0.000 0.001 0.000 0.000 Betweenness centrality 0.000 0.045 0.004 0.007 Betweenness centrality [Unscaled] 0.000 555.291 46.688 82.039 Hub centrality 0.000 0.458 0.097 0.092 Authority centrality 0.000 0.862 0.070 0.114 Information centrality 0.000 0.015 0.009 0.003 Information centrality [Unscaled] 0.000 2.229 1.311 0.472 Clique membership count 0.000 98.000 5.438 11.106 Simmelian ties 0.000 0.000 0.000 0.000 Simmelian ties [Unscaled] 0.000 0.000 0.000 0.000 Clustering coefficient 0.000 0.500 0.086 0.090
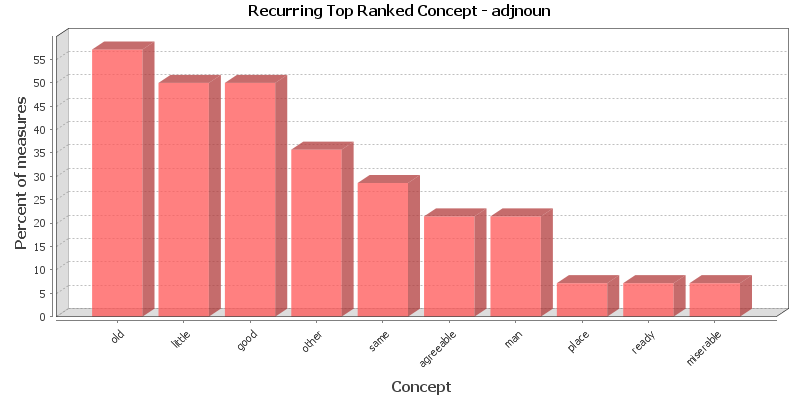
Key Nodes
This chart shows the Concept that is repeatedly top-ranked in the measures listed below. The value shown is the percentage of measures for which the Concept was ranked in the top three.
Total degree centrality
The Total Degree Centrality of a node is the normalized sum of its row and column degrees. Individuals or organizations who are "in the know" are those who are linked to many others and so, by virtue of their position have access to the ideas, thoughts, beliefs of many others. Individuals who are "in the know" are identified by degree centrality in the relevant social network. Those who are ranked high on this metrics have more connections to others in the same network. The scientific name of this measure is total degree centrality and it is calculated on the agent by agent matrices.
Input network: concept x concept (size: 112, density: 0.034186)
Rank Concept Value Unscaled Context* 1 little 0.221 49.000 10.864 2 old 0.149 33.000 6.667 3 other 0.126 28.000 5.355 4 good 0.126 28.000 5.355 5 same 0.095 21.000 3.518 6 first 0.077 17.000 2.469 7 room 0.068 15.000 1.944 8 way 0.068 15.000 1.944 9 dear 0.068 15.000 1.944 10 man 0.063 14.000 1.682 * Number of standard deviations from the mean of a random network of the same size and density
Mean: 0.034 Mean in random network: 0.034 Std.dev: 0.031 Std.dev in random network: 0.017 In-degree centrality
The In Degree Centrality of a node is its normalized in-degree. For any node, e.g. an individual or a resource, the in-links are the connections that the node of interest receives from other nodes. For example, imagine an agent by knowledge matrix then the number of in-links a piece of knowledge has is the number of agents that are connected to. The scientific name of this measure is in-degree and it is calculated on the agent by agent matrices.
Input network(s): concept x concept
Rank Concept Value Unscaled 1 little 0.360 40.000 2 old 0.279 31.000 3 man 0.117 13.000 4 first 0.117 13.000 5 other 0.108 12.000 6 room 0.099 11.000 7 way 0.099 11.000 8 round 0.090 10.000 9 face 0.090 10.000 10 young 0.090 10.000 Out-degree centrality
For any node, e.g. an individual or a resource, the out-links are the connections that the node of interest sends to other nodes. For example, imagine an agent by knowledge matrix then the number of out-links an agent would have is the number of pieces of knowledge it is connected to. The scientific name of this measure is out-degree and it is calculated on the agent by agent matrices. Individuals or organizations who are high in most knowledge have more expertise or are associated with more types of knowledge than are others. If no sub-network connecting agents to knowledge exists, then this measure will not be calculated. The scientific name of this measure is out degree centrality and it is calculated on agent by knowledge matrices. Individuals or organizations who are high in "most resources" have more resources or are associated with more types of resources than are others. If no sub-network connecting agents to resources exists, then this measure will not be calculated. The scientific name of this measure is out degree centrality and it is calculated on agent by resource matrices.
Input network(s): concept x concept
Rank Concept Value Unscaled 1 good 0.180 20.000 2 same 0.180 20.000 3 other 0.144 16.000 4 small 0.090 10.000 5 poor 0.090 10.000 6 little 0.081 9.000 7 new 0.081 9.000 8 whole 0.081 9.000 9 dear 0.072 8.000 10 pretty 0.072 8.000 Eigenvector centrality
Calculates the principal eigenvector of the network. A node is central to the extent that its neighbors are central. Leaders of strong cliques are individuals who or organizations who are collected to others that are themselves highly connected to each other. In other words, if you have a clique then the individual most connected to others in the clique and other cliques, is the leader of the clique. Individuals or organizations who are connected to many otherwise isolated individuals or organizations will have a much lower score in this measure then those that are connected to groups that have many connections themselves. The scientific name of this measure is eigenvector centrality and it is calculated on agent by agent matrices.
Input network: concept x concept (size: 112, density: 0.034186)
Rank Concept Value Unscaled Context* 1 little 0.567 0.401 -1.748 2 old 0.401 0.283 -2.526 3 good 0.342 0.242 -2.798 4 other 0.311 0.220 -2.945 5 same 0.266 0.188 -3.153 6 dear 0.228 0.161 -3.333 7 room 0.212 0.150 -3.409 8 thing 0.211 0.149 -3.413 9 pretty 0.205 0.145 -3.442 10 place 0.201 0.142 -3.460 * Number of standard deviations from the mean of a random network of the same size and density
Mean: 0.102 Mean in random network: 0.941 Std.dev: 0.086 Std.dev in random network: 0.214 Eigenvector centrality per component
Calculates the principal eigenvector of the network. A node is central to the extent that its neighbors are central. Each component is extracted as a separate network, Eigenvector Centrality is computed on it and scaled according to the component size. The scores are then combined into a single result vector.
Input network(s): concept x concept
Rank Concept Value 1 little 0.401 2 old 0.283 3 good 0.242 4 other 0.220 5 same 0.188 6 dear 0.161 7 room 0.150 8 thing 0.149 9 pretty 0.145 10 place 0.142 Closeness centrality
The average closeness of a node to the other nodes in a network (also called out-closeness). Loosely, Closeness is the inverse of the average distance in the network from the node to all other nodes.
Input network: concept x concept (size: 112, density: 0.034186)
Rank Concept Value Unscaled Context* 1 usual 0.028 0.000 -4.063 2 strong 0.028 0.000 -4.080 3 same 0.027 0.000 -4.103 4 pleasant 0.023 0.000 -4.290 5 something 0.023 0.000 -4.302 6 natural 0.022 0.000 -4.318 7 manner 0.022 0.000 -4.331 8 wrong 0.021 0.000 -4.402 9 half 0.021 0.000 -4.404 10 light 0.020 0.000 -4.407 * Number of standard deviations from the mean of a random network of the same size and density
Mean: 0.013 Mean in random network: 0.117 Std.dev: 0.004 Std.dev in random network: 0.022 In-Closeness centrality
The average closeness of a node from the other nodes in a network. Loosely, Closeness is the inverse of the average distance in the network to the node and from all other nodes.
Input network(s): concept x concept
Rank Concept Value Unscaled 1 agreeable 0.105 0.001 2 man 0.099 0.001 3 old 0.073 0.001 4 person 0.049 0.000 5 aunt 0.042 0.000 6 first 0.042 0.000 7 beautiful 0.042 0.000 8 bad 0.041 0.000 9 anything 0.039 0.000 10 short 0.038 0.000 Betweenness centrality
The Betweenness Centrality of node v in a network is defined as: across all node pairs that have a shortest path containing v, the percentage that pass through v. Individuals or organizations that are potentially influential are positioned to broker connections between groups and to bring to bear the influence of one group on another or serve as a gatekeeper between groups. This agent occurs on many of the shortest paths between other agents. The scientific name of this measure is betweenness centrality and it is calculated on agent by agent matrices.
Input network: concept x concept (size: 112, density: 0.034186)
Rank Concept Value Unscaled Context* 1 little 0.045 555.291 0.189 2 other 0.037 448.570 0.115 3 good 0.028 342.065 0.041 4 new 0.018 225.531 -0.040 5 dear 0.018 220.639 -0.043 6 first 0.012 150.757 -0.092 7 kind 0.012 145.923 -0.095 8 whole 0.012 140.797 -0.099 9 pretty 0.010 124.639 -0.110 10 manner 0.010 119.817 -0.113 * Number of standard deviations from the mean of a random network of the same size and density
Mean: 0.004 Mean in random network: 0.023 Std.dev: 0.007 Std.dev in random network: 0.118 Hub centrality
A node is hub-central to the extent that its out-links are to nodes that have many in-links. Individuals or organizations that act as hubs are sending information to a wide range of others each of whom has many others reporting to them. Technically, an agent is hub-central if its out-links are to agents that have many other agents sending links to them. The scientific name of this measure is hub centrality and it is calculated on agent by agent matrices.
Input network(s): concept x concept
Rank Concept Value 1 good 0.458 2 same 0.429 3 other 0.352 4 poor 0.280 5 pretty 0.268 6 dear 0.261 7 friend 0.234 8 little 0.220 9 small 0.220 10 thing 0.218 Authority centrality
A node is authority-central to the extent that its in-links are from nodes that have many out-links. Individuals or organizations that act as authorities are receiving information from a wide range of others each of whom sends information to a large number of others. Technically, an agent is authority-central if its in-links are from agents that have are sending links to many others. The scientific name of this measure is authority centrality and it is calculated on agent by agent matrices.
Input network(s): concept x concept
Rank Concept Value 1 little 0.862 2 old 0.639 3 place 0.235 4 young 0.232 5 boy 0.226 6 face 0.217 7 room 0.207 8 way 0.199 9 man 0.199 10 round 0.198 Information centrality
Calculate the Stephenson and Zelen information centrality measure for each node.
Input network(s): concept x concept
Rank Concept Value Unscaled 1 good 0.015 2.229 2 same 0.015 2.223 3 other 0.015 2.175 4 little 0.014 2.028 5 small 0.014 2.002 6 poor 0.014 2.002 7 whole 0.013 1.969 8 new 0.013 1.964 9 dear 0.013 1.918 10 pretty 0.013 1.913 Clique membership count
The number of distinct cliques to which each node belongs. Individuals or organizations who are high in number of cliques are those that belong to a large number of distinct cliques. A clique is defined as a group of three or more actors that have many connections to each other and relatively fewer connections to those in other groups. The scientific name of this measure is clique count and it is calculated on the agent by agent matrices.
Input network(s): concept x concept
Rank Concept Value 1 little 98.000 2 old 49.000 3 good 31.000 4 other 27.000 5 same 20.000 6 dear 18.000 7 thing 15.000 8 face 12.000 9 young 12.000 10 pretty 12.000 Simmelian ties
The normalized number of Simmelian ties of each node.
Input network(s): concept x concept
Rank Concept Value Unscaled 1 All nodes have this value 0.000 Clustering coefficient
Measures the degree of clustering in a network by averaging the clustering coefficient of each node, which is defined as the density of the node's ego network.
Input network(s): concept x concept
Rank Concept Value 1 ready 0.500 2 miserable 0.500 3 agreeable 0.333 4 letter 0.333 5 woman 0.214 6 door 0.214 7 night 0.200 8 pleasant 0.200 9 friend 0.167 10 child 0.167
Key Nodes Table
This shows the top scoring nodes side-by-side for selected measures.
Rank Betweenness centrality Closeness centrality Eigenvector centrality Eigenvector centrality per component In-degree centrality In-Closeness centrality Out-degree centrality Total degree centrality 1 little usual little little little agreeable good little 2 other strong old old old man same old 3 good same good good man old other other 4 new pleasant other other first person small good 5 dear something same same other aunt poor same 6 first natural dear dear room first little first 7 kind manner room room way beautiful new room 8 whole wrong thing thing round bad whole way 9 pretty half pretty pretty face anything dear dear 10 manner light place place young short pretty man