Calculates common social network measures on each selected input network.
Network test
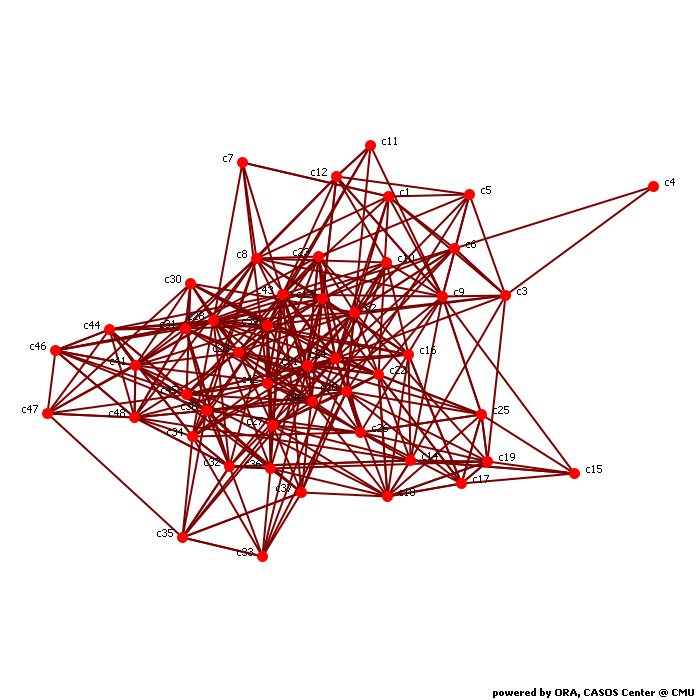
Network Level Measures
Measure Value Row count 48.000 Column count 48.000 Link count 352.000 Density 0.156 Components of 1 node (isolates) 0 Components of 2 nodes (dyadic isolates) 0 Components of 3 or more nodes 1 Reciprocity 0.239 Characteristic path length -132293247643942910.000 Clustering coefficient 0.259 Network levels (diameter) 0.000 Network fragmentation 0.000 Krackhardt connectedness 1.000 Krackhardt efficiency 0.781 Krackhardt hierarchy 0.042 Krackhardt upperboundedness 1.000 Degree centralization 0.131 Betweenness centralization -1.#IO Closeness centralization 0.001 Eigenvector centralization 0.458 Reciprocal (symmetric)? No (23% of the links are reciprocal)
Node Level Measures
Measure Min Max Avg Stddev Total degree centrality -0.128 0.170 0.044 0.064 Total degree centrality [Unscaled] -12.000 16.000 4.167 5.970 In-degree centrality -0.340 0.298 0.044 0.126 In-degree centrality [Unscaled] -16.000 14.000 2.083 5.901 Out-degree centrality -0.064 0.191 0.044 0.056 Out-degree centrality [Unscaled] -3.000 9.000 2.083 2.652 Eigenvector centrality -0.323 0.473 0.034 0.201 Eigenvector centrality [Unscaled] -0.229 0.334 0.024 0.142 Eigenvector centrality per component -0.229 0.334 0.024 0.142 Closeness centrality -0.021 -0.000 -0.000 0.003 Closeness centrality [Unscaled] 0.000 0.000 0.000 0.000 In-Closeness centrality 36272336896.000 26458647810801664.000 5512250097941504.000 10745275303782882.000 In-Closeness centrality [Unscaled] -562949919866880.000 -771751808.000 -117281909986942.670 228622865176899.970 Betweenness centrality 0.000 1.#IO 1.#IO -1.#IO Betweenness centrality [Unscaled] 0.000 1.#IO 1.#IO -1.#IO Hub centrality -0.032 0.453 0.170 0.113 Authority centrality -0.614 0.529 0.048 0.198 Information centrality -0.012 0.463 0.021 0.066 Information centrality [Unscaled] -0.911 34.386 1.547 4.869 Clique membership count 1.000 32.000 12.333 6.593 Simmelian ties 0.000 0.106 0.027 0.034 Simmelian ties [Unscaled] 0.000 5.000 1.292 1.594 Clustering coefficient 0.143 1.000 0.259 0.127
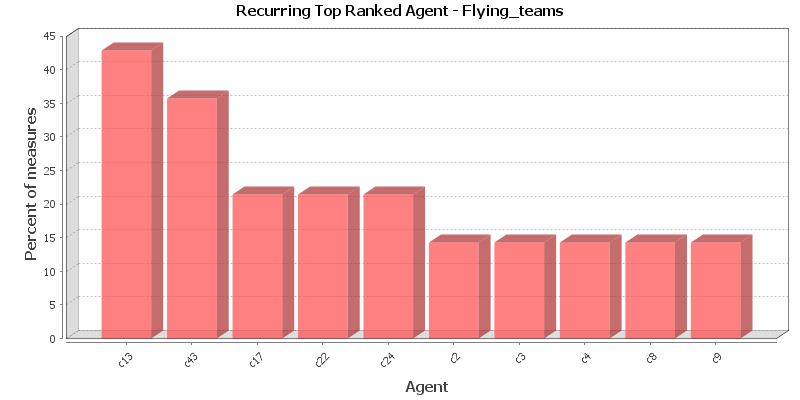
Key Nodes
This chart shows the Agent that is repeatedly top-ranked in the measures listed below. The value shown is the percentage of measures for which the Agent was ranked in the top three.
Total degree centrality
The Total Degree Centrality of a node is the normalized sum of its row and column degrees. Individuals or organizations who are "in the know" are those who are linked to many others and so, by virtue of their position have access to the ideas, thoughts, beliefs of many others. Individuals who are "in the know" are identified by degree centrality in the relevant social network. Those who are ranked high on this metrics have more connections to others in the same network. The scientific name of this measure is total degree centrality and it is calculated on the agent by agent matrices.
Input network: test (size: 48, density: 0.156028)
Rank Agent Value Unscaled Context* 1 c13 0.170 16.000 0.271 2 c9 0.160 15.000 0.068 3 c43 0.160 15.000 0.068 4 c22 0.149 14.000 -0.135 5 c25 0.149 14.000 -0.135 6 c16 0.128 12.000 -0.542 7 c17 0.117 11.000 -0.745 8 c14 0.106 10.000 -0.948 9 c48 0.106 10.000 -0.948 10 c10 0.096 9.000 -1.151 * Number of standard deviations from the mean of a random network of the same size and density
Mean: 0.044 Mean in random network: 0.156 Std.dev: 0.064 Std.dev in random network: 0.052 In-degree centrality
The In Degree Centrality of a node is its normalized in-degree. For any node, e.g. an individual or a resource, the in-links are the connections that the node of interest receives from other nodes. For example, imagine an agent by knowledge matrix then the number of in-links a piece of knowledge has is the number of agents that are connected to. The scientific name of this measure is in-degree and it is calculated on the agent by agent matrices.
Input network(s): test
Rank Agent Value Unscaled 1 c13 0.298 14.000 2 c9 0.213 10.000 3 c43 0.191 9.000 4 c16 0.170 8.000 5 c18 0.170 8.000 6 c21 0.170 8.000 7 c41 0.170 8.000 8 c48 0.170 8.000 9 c14 0.149 7.000 10 c25 0.149 7.000 Out-degree centrality
For any node, e.g. an individual or a resource, the out-links are the connections that the node of interest sends to other nodes. For example, imagine an agent by knowledge matrix then the number of out-links an agent would have is the number of pieces of knowledge it is connected to. The scientific name of this measure is out-degree and it is calculated on the agent by agent matrices. Individuals or organizations who are high in most knowledge have more expertise or are associated with more types of knowledge than are others. If no sub-network connecting agents to knowledge exists, then this measure will not be calculated. The scientific name of this measure is out degree centrality and it is calculated on agent by knowledge matrices. Individuals or organizations who are high in "most resources" have more resources or are associated with more types of resources than are others. If no sub-network connecting agents to resources exists, then this measure will not be calculated. The scientific name of this measure is out degree centrality and it is calculated on agent by resource matrices.
Input network(s): test
Rank Agent Value Unscaled 1 c22 0.191 9.000 2 c25 0.149 7.000 3 c17 0.128 6.000 4 c27 0.128 6.000 5 c43 0.128 6.000 6 c3 0.106 5.000 7 c9 0.106 5.000 8 c10 0.106 5.000 9 c15 0.106 5.000 10 c31 0.106 5.000 Eigenvector centrality
Calculates the principal eigenvector of the network. A node is central to the extent that its neighbors are central. Leaders of strong cliques are individuals who or organizations who are collected to others that are themselves highly connected to each other. In other words, if you have a clique then the individual most connected to others in the clique and other cliques, is the leader of the clique. Individuals or organizations who are connected to many otherwise isolated individuals or organizations will have a much lower score in this measure then those that are connected to groups that have many connections themselves. The scientific name of this measure is eigenvector centrality and it is calculated on agent by agent matrices.
Input network: test (size: 48, density: 0.156028)
Rank Agent Value Unscaled Context* 1 c24 0.473 0.334 -0.181 2 c8 0.425 0.301 -0.359 3 c13 0.415 0.294 -0.398 4 c21 0.409 0.289 -0.421 5 c43 0.371 0.262 -0.565 6 c16 0.321 0.227 -0.750 7 c39 0.314 0.222 -0.776 8 c23 0.311 0.220 -0.789 9 c10 0.268 0.189 -0.951 10 c2 0.236 0.167 -1.070 * Number of standard deviations from the mean of a random network of the same size and density
Mean: 0.034 Mean in random network: 0.521 Std.dev: 0.201 Std.dev in random network: 0.266 Eigenvector centrality per component
Calculates the principal eigenvector of the network. A node is central to the extent that its neighbors are central. Each component is extracted as a separate network, Eigenvector Centrality is computed on it and scaled according to the component size. The scores are then combined into a single result vector.
Input network(s): test
Rank Agent Value 1 c24 0.334 2 c8 0.301 3 c13 0.294 4 c21 0.289 5 c43 0.262 6 c16 0.227 7 c39 0.222 8 c23 0.220 9 c10 0.189 10 c2 0.167 Closeness centrality
The average closeness of a node to the other nodes in a network (also called out-closeness). Loosely, Closeness is the inverse of the average distance in the network from the node to all other nodes.
Input network: test (size: 48, density: 0.156028)
Rank Agent Value Context* 1 c1 -0.000 -7.636 2 c2 -0.000 -7.636 3 c3 -0.000 -7.636 4 c5 -0.000 -7.636 5 c6 -0.000 -7.636 6 c7 -0.000 -7.636 7 c8 -0.000 -7.636 8 c9 -0.000 -7.636 9 c10 -0.000 -7.636 10 c11 -0.000 -7.636 * Number of standard deviations from the mean of a random network of the same size and density
Mean: -0.000 Mean in random network: 0.426 Std.dev: 0.003 Std.dev in random network: 0.056 In-Closeness centrality
The average closeness of a node from the other nodes in a network. Loosely, Closeness is the inverse of the average distance in the network to the node and from all other nodes.
Input network(s): test
Rank Agent Value 1 c2 26458647810801664.000 2 c3 26458647810801664.000 3 c4 26458647810801664.000 4 c5 26458647810801664.000 5 c6 26458647810801664.000 6 c9 26458647810801664.000 7 c14 26458647810801664.000 8 c15 26458647810801664.000 9 c17 26458647810801664.000 10 c19 26458647810801664.000 Betweenness centrality
The Betweenness Centrality of node v in a network is defined as: across all node pairs that have a shortest path containing v, the percentage that pass through v. Individuals or organizations that are potentially influential are positioned to broker connections between groups and to bring to bear the influence of one group on another or serve as a gatekeeper between groups. This agent occurs on many of the shortest paths between other agents. The scientific name of this measure is betweenness centrality and it is calculated on agent by agent matrices.
Input network: test (size: 48, density: 0.156028)
Rank Agent Value Unscaled Context* 1 c14 1.#IO 1.#IO 1.#IO 2 c15 614814061502677980000000000000000.000 1329227995784915900000000000000000000.000 27606983903453208000000000000000000.000 3 c17 153703515375669490000000000000000.000 332306998946228980000000000000000000.000 6901745975863302100000000000000000.000 4 c19 48461367569066068000000000.000 104773473437693880000000000000.000 2176059834478466000000000000.000 5 c27 70363431337478586000.000 152125740733059770000000.000 3159527903129489100000.000 6 c2 69896266439022608000.000 151115727451828650000000.000 3138550699015150800000.000 7 c18 67431636358572016000.000 145787194473513440000000.000 3027881493571961900000.000 8 c20 40546699093588574000.000 87661963264416637000000.000 1820667688082280000000.000 9 c24 32982861737977971000.000 71308947161071256000000.000 1481028862921622400000.000 10 c13 21500622226694603000.000 46484344906668057000000.000 965442070512714910000.000 * Number of standard deviations from the mean of a random network of the same size and density
Mean: 1.#IO Mean in random network: 0.033 Std.dev: -1.#IO Std.dev in random network: 0.022 Hub centrality
A node is hub-central to the extent that its out-links are to nodes that have many in-links. Individuals or organizations that act as hubs are sending information to a wide range of others each of whom has many others reporting to them. Technically, an agent is hub-central if its out-links are to agents that have many other agents sending links to them. The scientific name of this measure is hub centrality and it is calculated on agent by agent matrices.
Input network(s): test
Rank Agent Value 1 c22 0.453 2 c29 0.369 3 c44 0.358 4 c21 0.355 5 c39 0.342 6 c43 0.315 7 c8 0.292 8 c46 0.289 9 c32 0.287 10 c36 0.279 Authority centrality
A node is authority-central to the extent that its in-links are from nodes that have many out-links. Individuals or organizations that act as authorities are receiving information from a wide range of others each of whom sends information to a large number of others. Technically, an agent is authority-central if its in-links are from agents that have are sending links to many others. The scientific name of this measure is authority centrality and it is calculated on agent by agent matrices.
Input network(s): test
Rank Agent Value 1 c13 0.529 2 c21 0.306 3 c43 0.298 4 c9 0.277 5 c16 0.264 6 c41 0.258 7 c48 0.253 8 c18 0.220 9 c38 0.213 10 c29 0.177 Information centrality
Calculate the Stephenson and Zelen information centrality measure for each node.
Input network(s): test
Rank Agent Value Unscaled 1 c31 0.463 34.386 2 c43 0.031 2.281 3 c22 0.030 2.259 4 c15 0.029 2.123 5 c27 0.028 2.116 6 c16 0.028 2.108 7 c25 0.027 2.033 8 c3 0.027 2.026 9 c13 0.026 1.914 10 c17 0.025 1.889 Clique membership count
The number of distinct cliques to which each node belongs. Individuals or organizations who are high in number of cliques are those that belong to a large number of distinct cliques. A clique is defined as a group of three or more actors that have many connections to each other and relatively fewer connections to those in other groups. The scientific name of this measure is clique count and it is calculated on the agent by agent matrices.
Input network(s): test
Rank Agent Value 1 c43 32.000 2 c24 26.000 3 c13 22.000 4 c20 22.000 5 c21 22.000 6 c28 22.000 7 c39 19.000 8 c2 18.000 9 c27 18.000 10 c29 18.000 Simmelian ties
The normalized number of Simmelian ties of each node.
Input network(s): test
Rank Agent Value Unscaled 1 c48 0.106 5.000 2 c17 0.085 4.000 3 c21 0.085 4.000 4 c32 0.085 4.000 5 c38 0.085 4.000 6 c41 0.085 4.000 7 c43 0.085 4.000 8 c18 0.064 3.000 9 c19 0.064 3.000 10 c39 0.064 3.000 Clustering coefficient
Measures the degree of clustering in a network by averaging the clustering coefficient of each node, which is defined as the density of the node's ego network.
Input network(s): test
Rank Agent Value 1 c4 1.000 2 c15 0.500 3 c46 0.429 4 c33 0.357 5 c47 0.357 6 c25 0.333 7 c10 0.306 8 c11 0.300 9 c44 0.291 10 c23 0.280
Key Nodes Table
This shows the top scoring nodes side-by-side for selected measures.
Rank Betweenness centrality Closeness centrality Eigenvector centrality Eigenvector centrality per component In-degree centrality In-Closeness centrality Out-degree centrality Total degree centrality 1 c14 c1 c24 c24 c13 c2 c22 c13 2 c15 c2 c8 c8 c9 c3 c25 c9 3 c17 c3 c13 c13 c43 c4 c17 c43 4 c19 c5 c21 c21 c16 c5 c27 c22 5 c27 c6 c43 c43 c18 c6 c43 c25 6 c2 c7 c16 c16 c21 c9 c3 c16 7 c18 c8 c39 c39 c41 c14 c9 c17 8 c20 c9 c23 c23 c48 c15 c10 c14 9 c24 c10 c10 c10 c14 c17 c15 c48 10 c13 c11 c2 c2 c25 c19 c31 c10