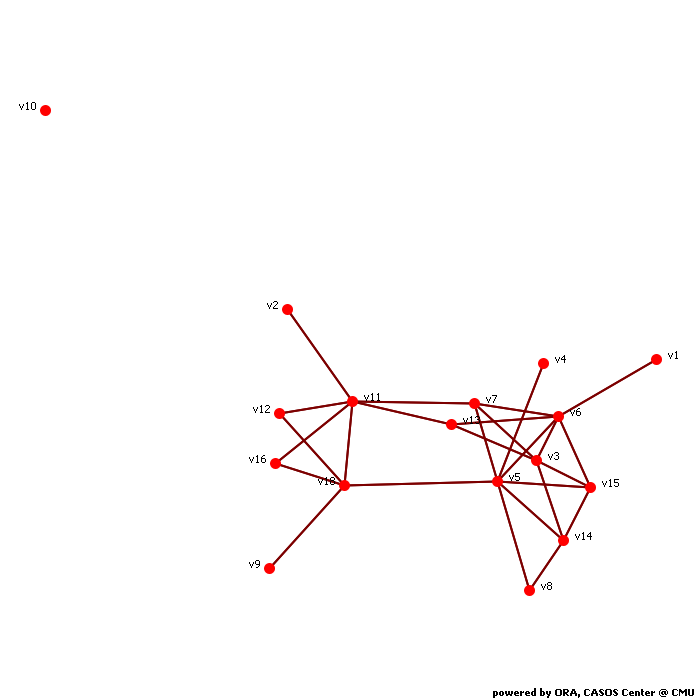
Calculates common social network measures on each selected input network.
Network test
Network Level Measures
Measure Value Row count 17.000 Column count 17.000 Link count 27.000 Density 0.199 Components of 1 node (isolates) 1 Components of 2 nodes (dyadic isolates) 0 Components of 3 or more nodes 1 Reciprocity 1.000 Characteristic path length 2.225 Clustering coefficient 0.358 Network levels (diameter) 4.000 Network fragmentation 0.118 Krackhardt connectedness 0.882 Krackhardt efficiency 0.886 Krackhardt hierarchy 0.000 Krackhardt upperboundedness 1.000 Degree centralization 0.271 Betweenness centralization 0.303 Closeness centralization 0.185 Eigenvector centralization 0.344 Reciprocal (symmetric)? Yes
Node Level Measures
Measure Min Max Avg Stddev Total degree centrality 0.000 0.438 0.199 0.129 Total degree centrality [Unscaled] 0.000 7.000 3.176 2.065 In-degree centrality 0.000 0.438 0.199 0.129 In-degree centrality [Unscaled] 0.000 7.000 3.176 2.065 Out-degree centrality 0.000 0.438 0.199 0.129 Out-degree centrality [Unscaled] 0.000 7.000 3.176 2.065 Eigenvector centrality 0.000 0.593 0.289 0.185 Eigenvector centrality [Unscaled] 0.000 0.419 0.204 0.131 Eigenvector centrality per component 0.000 0.394 0.192 0.123 Closeness centrality 0.059 0.390 0.306 0.071 Closeness centrality [Unscaled] 0.004 0.024 0.019 0.004 In-Closeness centrality 0.059 0.390 0.306 0.071 In-Closeness centrality [Unscaled] 0.004 0.024 0.019 0.004 Betweenness centrality 0.000 0.357 0.072 0.106 Betweenness centrality [Unscaled] 0.000 42.833 8.647 12.761 Hub centrality 0.000 0.593 0.289 0.185 Authority centrality 0.000 0.593 0.289 0.185 Information centrality 0.000 0.087 0.059 0.022 Information centrality [Unscaled] 0.000 1.417 0.963 0.365 Clique membership count 0.000 5.000 1.765 1.628 Simmelian ties 0.000 0.313 0.147 0.113 Simmelian ties [Unscaled] 0.000 5.000 2.353 1.813 Clustering coefficient 0.000 1.000 0.358 0.351
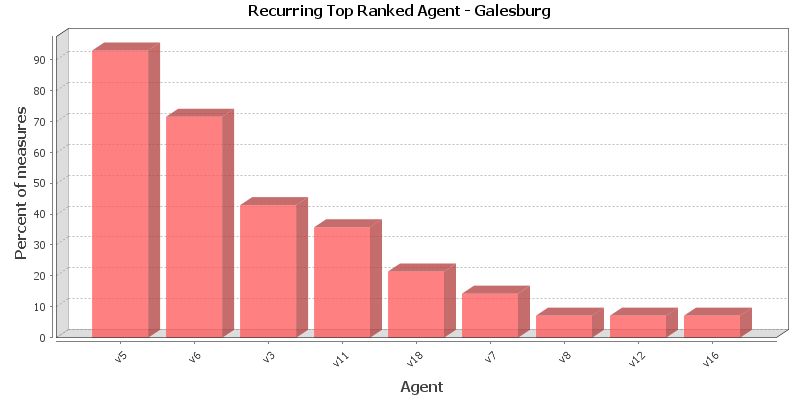
Key Nodes
This chart shows the Agent that is repeatedly top-ranked in the measures listed below. The value shown is the percentage of measures for which the Agent was ranked in the top three.
Total degree centrality
The Total Degree Centrality of a node is the normalized sum of its row and column degrees. Individuals or organizations who are "in the know" are those who are linked to many others and so, by virtue of their position have access to the ideas, thoughts, beliefs of many others. Individuals who are "in the know" are identified by degree centrality in the relevant social network. Those who are ranked high on this metrics have more connections to others in the same network. The scientific name of this measure is total degree centrality and it is calculated on the agent by agent matrices.
Input network: test (size: 17, density: 0.198529)
Rank Agent Value Unscaled Context* 1 v5 0.438 7.000 2.470 2 v6 0.375 6.000 1.824 3 v11 0.375 6.000 1.824 4 v3 0.313 5.000 1.178 5 v18 0.313 5.000 1.178 6 v7 0.250 4.000 0.532 7 v14 0.250 4.000 0.532 8 v15 0.250 4.000 0.532 9 v13 0.188 3.000 -0.114 10 v8 0.125 2.000 -0.760 * Number of standard deviations from the mean of a random network of the same size and density
Mean: 0.199 Mean in random network: 0.199 Std.dev: 0.129 Std.dev in random network: 0.097 In-degree centrality
The In Degree Centrality of a node is its normalized in-degree. For any node, e.g. an individual or a resource, the in-links are the connections that the node of interest receives from other nodes. For example, imagine an agent by knowledge matrix then the number of in-links a piece of knowledge has is the number of agents that are connected to. The scientific name of this measure is in-degree and it is calculated on the agent by agent matrices.
Input network(s): test
Rank Agent Value Unscaled 1 v5 0.438 7.000 2 v6 0.375 6.000 3 v11 0.375 6.000 4 v3 0.313 5.000 5 v18 0.313 5.000 6 v7 0.250 4.000 7 v14 0.250 4.000 8 v15 0.250 4.000 9 v13 0.188 3.000 10 v8 0.125 2.000 Out-degree centrality
For any node, e.g. an individual or a resource, the out-links are the connections that the node of interest sends to other nodes. For example, imagine an agent by knowledge matrix then the number of out-links an agent would have is the number of pieces of knowledge it is connected to. The scientific name of this measure is out-degree and it is calculated on the agent by agent matrices. Individuals or organizations who are high in most knowledge have more expertise or are associated with more types of knowledge than are others. If no sub-network connecting agents to knowledge exists, then this measure will not be calculated. The scientific name of this measure is out degree centrality and it is calculated on agent by knowledge matrices. Individuals or organizations who are high in "most resources" have more resources or are associated with more types of resources than are others. If no sub-network connecting agents to resources exists, then this measure will not be calculated. The scientific name of this measure is out degree centrality and it is calculated on agent by resource matrices.
Input network(s): test
Rank Agent Value Unscaled 1 v5 0.438 7.000 2 v6 0.375 6.000 3 v11 0.375 6.000 4 v3 0.313 5.000 5 v18 0.313 5.000 6 v7 0.250 4.000 7 v14 0.250 4.000 8 v15 0.250 4.000 9 v13 0.188 3.000 10 v8 0.125 2.000 Eigenvector centrality
Calculates the principal eigenvector of the network. A node is central to the extent that its neighbors are central. Leaders of strong cliques are individuals who or organizations who are collected to others that are themselves highly connected to each other. In other words, if you have a clique then the individual most connected to others in the clique and other cliques, is the leader of the clique. Individuals or organizations who are connected to many otherwise isolated individuals or organizations will have a much lower score in this measure then those that are connected to groups that have many connections themselves. The scientific name of this measure is eigenvector centrality and it is calculated on agent by agent matrices.
Input network: test (size: 17, density: 0.198529)
Rank Agent Value Unscaled Context* 1 v5 0.593 0.419 0.437 2 v6 0.574 0.406 0.376 3 v3 0.516 0.365 0.193 4 v15 0.480 0.340 0.079 5 v7 0.460 0.325 0.014 6 v14 0.417 0.295 -0.125 7 v11 0.328 0.232 -0.407 8 v13 0.325 0.230 -0.419 9 v18 0.291 0.206 -0.527 10 v8 0.231 0.163 -0.718 * Number of standard deviations from the mean of a random network of the same size and density
Mean: 0.289 Mean in random network: 0.456 Std.dev: 0.185 Std.dev in random network: 0.313 Eigenvector centrality per component
Calculates the principal eigenvector of the network. A node is central to the extent that its neighbors are central. Each component is extracted as a separate network, Eigenvector Centrality is computed on it and scaled according to the component size. The scores are then combined into a single result vector.
Input network(s): test
Rank Agent Value 1 v5 0.394 2 v6 0.382 3 v3 0.344 4 v15 0.320 5 v7 0.306 6 v14 0.277 7 v11 0.219 8 v13 0.216 9 v18 0.194 10 v8 0.154 Closeness centrality
The average closeness of a node to the other nodes in a network (also called out-closeness). Loosely, Closeness is the inverse of the average distance in the network from the node to all other nodes.
Input network: test (size: 17, density: 0.198529)
Rank Agent Value Unscaled Context* 1 v5 0.390 0.024 -0.593 2 v7 0.364 0.023 -1.049 3 v18 0.364 0.023 -1.049 4 v6 0.356 0.022 -1.188 5 v11 0.348 0.022 -1.321 6 v13 0.340 0.021 -1.448 7 v3 0.327 0.020 -1.686 8 v15 0.327 0.020 -1.686 9 v14 0.320 0.020 -1.799 10 v8 0.302 0.019 -2.110 * Number of standard deviations from the mean of a random network of the same size and density
Mean: 0.306 Mean in random network: 0.425 Std.dev: 0.071 Std.dev in random network: 0.058 In-Closeness centrality
The average closeness of a node from the other nodes in a network. Loosely, Closeness is the inverse of the average distance in the network to the node and from all other nodes.
Input network(s): test
Rank Agent Value Unscaled 1 v5 0.390 0.024 2 v7 0.364 0.023 3 v18 0.364 0.023 4 v6 0.356 0.022 5 v11 0.348 0.022 6 v13 0.340 0.021 7 v3 0.327 0.020 8 v15 0.327 0.020 9 v14 0.320 0.020 10 v8 0.302 0.019 Betweenness centrality
The Betweenness Centrality of node v in a network is defined as: across all node pairs that have a shortest path containing v, the percentage that pass through v. Individuals or organizations that are potentially influential are positioned to broker connections between groups and to bring to bear the influence of one group on another or serve as a gatekeeper between groups. This agent occurs on many of the shortest paths between other agents. The scientific name of this measure is betweenness centrality and it is calculated on agent by agent matrices.
Input network: test (size: 17, density: 0.198529)
Rank Agent Value Unscaled Context* 1 v5 0.357 42.833 4.603 2 v18 0.247 29.667 2.719 3 v11 0.226 27.167 2.362 4 v6 0.160 19.167 1.217 5 v7 0.096 11.500 0.120 6 v13 0.057 6.833 -0.548 7 v3 0.046 5.500 -0.738 8 v14 0.024 2.833 -1.120 9 v15 0.013 1.500 -1.311 * Number of standard deviations from the mean of a random network of the same size and density
Mean: 0.072 Mean in random network: 0.089 Std.dev: 0.106 Std.dev in random network: 0.058 Hub centrality
A node is hub-central to the extent that its out-links are to nodes that have many in-links. Individuals or organizations that act as hubs are sending information to a wide range of others each of whom has many others reporting to them. Technically, an agent is hub-central if its out-links are to agents that have many other agents sending links to them. The scientific name of this measure is hub centrality and it is calculated on agent by agent matrices.
Input network(s): test
Rank Agent Value 1 v5 0.593 2 v6 0.574 3 v3 0.516 4 v15 0.480 5 v7 0.460 6 v14 0.417 7 v11 0.328 8 v13 0.325 9 v18 0.291 10 v8 0.231 Authority centrality
A node is authority-central to the extent that its in-links are from nodes that have many out-links. Individuals or organizations that act as authorities are receiving information from a wide range of others each of whom sends information to a large number of others. Technically, an agent is authority-central if its in-links are from agents that have are sending links to many others. The scientific name of this measure is authority centrality and it is calculated on agent by agent matrices.
Input network(s): test
Rank Agent Value 1 v5 0.593 2 v6 0.574 3 v3 0.516 4 v15 0.480 5 v7 0.460 6 v14 0.417 7 v11 0.328 8 v13 0.325 9 v18 0.291 10 v8 0.231 Information centrality
Calculate the Stephenson and Zelen information centrality measure for each node.
Input network(s): test
Rank Agent Value Unscaled 1 v5 0.087 1.417 2 v6 0.081 1.326 3 v11 0.080 1.309 4 v3 0.078 1.272 5 v7 0.078 1.271 6 v18 0.074 1.212 7 v15 0.072 1.186 8 v14 0.070 1.149 9 v13 0.069 1.133 10 v8 0.054 0.885 Clique membership count
The number of distinct cliques to which each node belongs. Individuals or organizations who are high in number of cliques are those that belong to a large number of distinct cliques. A clique is defined as a group of three or more actors that have many connections to each other and relatively fewer connections to those in other groups. The scientific name of this measure is clique count and it is calculated on the agent by agent matrices.
Input network(s): test
Rank Agent Value 1 v6 5.000 2 v3 4.000 3 v5 4.000 4 v15 4.000 5 v14 3.000 6 v7 2.000 7 v11 2.000 8 v18 2.000 9 v8 1.000 10 v12 1.000 Simmelian ties
The normalized number of Simmelian ties of each node.
Input network(s): test
Rank Agent Value Unscaled 1 v3 0.313 5.000 2 v5 0.313 5.000 3 v6 0.313 5.000 4 v14 0.250 4.000 5 v15 0.250 4.000 6 v7 0.188 3.000 7 v11 0.188 3.000 8 v18 0.188 3.000 9 v8 0.125 2.000 10 v12 0.125 2.000 Clustering coefficient
Measures the degree of clustering in a network by averaging the clustering coefficient of each node, which is defined as the density of the node's ego network.
Input network(s): test
Rank Agent Value 1 v8 1.000 2 v12 1.000 3 v16 1.000 4 v15 0.667 5 v14 0.500 6 v3 0.400 7 v6 0.333 8 v7 0.333 9 v13 0.333 10 v18 0.200
Key Nodes Table
This shows the top scoring nodes side-by-side for selected measures.
Rank Betweenness centrality Closeness centrality Eigenvector centrality Eigenvector centrality per component In-degree centrality In-Closeness centrality Out-degree centrality Total degree centrality 1 v5 v5 v5 v5 v5 v5 v5 v5 2 v18 v7 v6 v6 v6 v7 v6 v6 3 v11 v18 v3 v3 v11 v18 v11 v11 4 v6 v6 v15 v15 v3 v6 v3 v3 5 v7 v11 v7 v7 v18 v11 v18 v18 6 v13 v13 v14 v14 v7 v13 v7 v7 7 v3 v3 v11 v11 v14 v3 v14 v14 8 v14 v15 v13 v13 v15 v15 v15 v15 9 v15 v14 v18 v18 v13 v14 v13 v13 10 v1 v8 v8 v8 v8 v8 v8 v8