Calculates common social network measures on each selected input network.
Network Agent x Agent
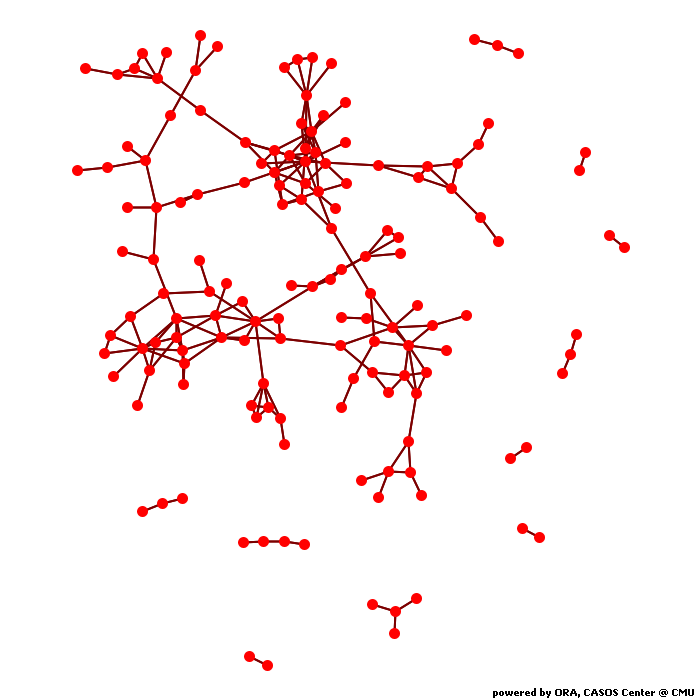
Network Level Measures
Measure Value Row count 205.000 Column count 205.000 Link count 202.000 Density 0.010 Isolate count 58.000 Component count 69.000 Reciprocity 1.000 Characteristic path length 6.811 Clustering coefficient 0.086 Network levels (diameter) 16.000 Network fragmentation 0.657 Krackhardt connectedness 0.343 Krackhardt efficiency 0.991 Krackhardt hierarchy 0.000 Krackhardt upperboundedness 1.000 Degree centralization 0.054 Betweenness centralization 0.168 Closeness centralization 0.006 Reciprocal? Yes
Node Level Measures
Measure Min Max Avg Stddev Total degree centrality 0.000 0.064 0.010 0.010 Total degree centrality [Unscaled] 0.000 26.000 3.941 4.246 In-degree centrality 0.000 0.063 0.010 0.010 In-degree centrality [Unscaled] 0.000 13.000 1.971 2.123 Out-degree centrality 0.000 0.063 0.010 0.010 Out-degree centrality [Unscaled] 0.000 13.000 1.971 2.123 Eigenvector centrality 0.000 1.000 0.160 0.312 Closeness centrality 0.005 0.011 0.009 0.003 Closeness centrality [Unscaled] 0.000 0.000 0.000 0.000 Betweenness centrality 0.000 0.177 0.010 0.025 Betweenness centrality [Unscaled] 0.000 7323.914 406.283 1023.370 Hub centrality 0.000 1.000 0.106 0.261 Authority centrality 0.000 1.000 0.106 0.261 Information centrality -0.001 0.008 0.005 0.004 Information centrality [Unscaled] -0.000 0.000 -0.000 0.000 Clique membership count 0.000 7.000 0.741 1.403 Simmelian ties 0.000 0.044 0.006 0.009 Simmelian ties [Unscaled] 0.000 9.000 1.171 1.919 Clustering coefficient 0.000 0.500 0.086 0.134
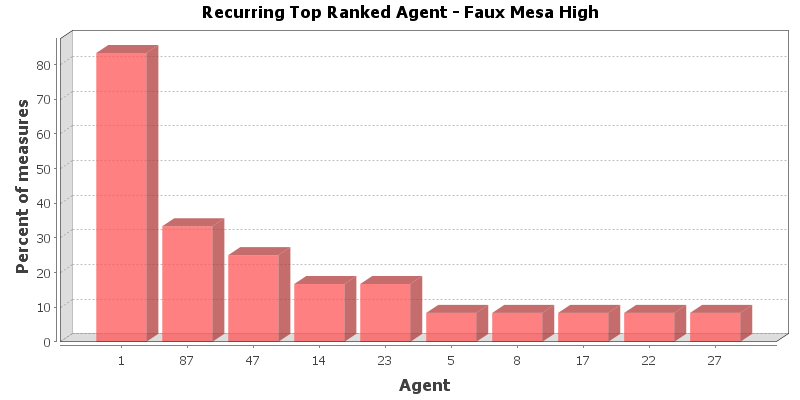
Key Nodes
This chart shows the Agent that is repeatedly top-ranked in the measures listed below. The value shown is the percentage of measures for which the Agent was ranked in the top three.
Total degree centrality
The Total Degree Centrality of a node is the normalized sum of its row and column degrees. Individuals or organizations who are "in the know" are those who are linked to many others and so, by virtue of their position have access to the ideas, thoughts, beliefs of many others. Individuals who are "in the know" are identified by degree centrality in the relevant social network. Those who are ranked high on this metrics have more connections to others in the same network. The scientific name of this measure is total degree centrality and it is calculated on the agent by agent matrices.
Input network: Agent x Agent (size: 205, density: 0.00956666)
Rank Agent Value Unscaled Context* 1 1 0.064 26.000 7.943 2 87 0.049 20.000 5.786 3 47 0.044 18.000 5.066 4 55 0.044 18.000 5.066 5 160 0.039 16.000 4.347 6 25 0.034 14.000 3.628 7 96 0.034 14.000 3.628 8 123 0.034 14.000 3.628 9 189 0.034 14.000 3.628 10 22 0.029 12.000 2.908 * Number of standard deviations from the mean of a random network of the same size and density
Mean: 0.010 Mean in random network: 0.010 Std.dev: 0.010 Std.dev in random network: 0.007 In-degree centrality
The In Degree Centrality of a node is its normalized in-degree. For any node, e.g. an individual or a resource, the in-links are the connections that the node of interest receives from other nodes. For example, imagine an agent by knowledge matrix then the number of in-links a piece of knowledge has is the number of agents that are connected to. The scientific name of this measure is in-degree and it is calculated on the agent by agent matrices.
Input network(s): Agent x Agent
Rank Agent Value Unscaled 1 1 0.063 13.000 2 87 0.049 10.000 3 47 0.044 9.000 4 55 0.044 9.000 5 160 0.039 8.000 6 25 0.034 7.000 7 96 0.034 7.000 8 123 0.034 7.000 9 189 0.034 7.000 10 22 0.029 6.000 Out-degree centrality
For any node, e.g. an individual or a resource, the out-links are the connections that the node of interest sends to other nodes. For example, imagine an agent by knowledge matrix then the number of out-links an agent would have is the number of pieces of knowledge it is connected to. The scientific name of this measure is out-degree and it is calculated on the agent by agent matrices. Individuals or organizations who are high in most knowledge have more expertise or are associated with more types of knowledge than are others. If no sub-network connecting agents to knowledge exists, then this measure will not be calculated. The scientific name of this measure is out degree centrality and it is calculated on agent by knowledge matrices. Individuals or organizations who are high in "most resources" have more resources or are associated with more types of resources than are others. If no sub-network connecting agents to resources exists, then this measure will not be calculated. The scientific name of this measure is out degree centrality and it is calculated on agent by resource matrices.
Input network(s): Agent x Agent
Rank Agent Value Unscaled 1 1 0.063 13.000 2 87 0.049 10.000 3 47 0.044 9.000 4 55 0.044 9.000 5 160 0.039 8.000 6 25 0.034 7.000 7 96 0.034 7.000 8 123 0.034 7.000 9 189 0.034 7.000 10 22 0.029 6.000 Eigenvector centrality
Calculates the principal eigenvector of the network. A node is central to the extent that its neighbors are central. Leaders of strong cliques are individuals who or organizations who are collected to others that are themselves highly connected to each other. In other words, if you have a clique then the individual most connected to others in the clique and other cliques, is the leader of the clique. Individuals or organizations who are connected to many otherwise isolated individuals or organizations will have a much lower score in this measure then those that are connected to groups that have many connections themselves. The scientific name of this measure is eigenvector centrality and it is calculated on agent by agent matrices.
Input network: Agent x Agent (size: 205, density: 0.00956666)
Rank Agent Value Context* 1 1 1.000 3.831 2 17 1.000 3.831 3 27 1.000 3.831 4 36 1.000 3.831 5 38 1.000 3.831 6 57 1.000 3.831 7 89 1.000 3.831 8 90 1.000 3.831 9 103 1.000 3.831 10 117 1.000 3.831 * Number of standard deviations from the mean of a random network of the same size and density
Mean: 0.160 Mean in random network: 0.272 Std.dev: 0.312 Std.dev in random network: 0.190 Closeness centrality
The average closeness of a node to the other nodes in a network. Loosely, Closeness is the inverse of the average distance in the network between the node and all other nodes.
Input network: Agent x Agent (size: 205, density: 0.00956666)
Rank Agent Value Unscaled Context* 1 1 0.011 0.000 -1.928 2 58 0.011 0.000 -1.930 3 161 0.011 0.000 -1.931 4 160 0.011 0.000 -1.932 5 124 0.011 0.000 -1.932 6 149 0.011 0.000 -1.932 7 165 0.011 0.000 -1.933 8 140 0.011 0.000 -1.934 9 123 0.011 0.000 -1.934 10 178 0.011 0.000 -1.935 * Number of standard deviations from the mean of a random network of the same size and density
Mean: 0.009 Mean in random network: 0.020 Std.dev: 0.003 Std.dev in random network: 0.005 Betweenness centrality
The Betweenness Centrality of node v in a network is defined as: across all node pairs that have a shortest path containing v, the percentage that pass through v. Individuals or organizations that are potentially influential are positioned to broker connections between groups and to bring to bear the influence of one group on another or serve as a gatekeeper between groups. This agent occurs on many of the shortest paths between other agents. The scientific name of this measure is betweenness centrality and it is calculated on agent by agent matrices.
Input network: Agent x Agent (size: 205, density: 0.00956666)
Rank Agent Value Unscaled Context* 1 1 0.177 7323.914 6.043 2 165 0.118 4885.947 3.802 3 149 0.100 4149.946 3.126 4 58 0.098 4075.947 3.058 5 123 0.098 4065.048 3.048 6 178 0.093 3861.947 2.861 7 160 0.091 3782.053 2.788 8 47 0.090 3717.912 2.729 9 161 0.079 3270.886 2.318 10 124 0.078 3212.053 2.264 * Number of standard deviations from the mean of a random network of the same size and density
Mean: 0.010 Mean in random network: 0.018 Std.dev: 0.025 Std.dev in random network: 0.026 Hub centrality
A node is hub-central to the extent that its out-links are to nodes that have many in-links. Individuals or organizations that act as hubs are sending information to a wide range of others each of whom has many others reporting to them. Technically, an agent is hub-central if its out-links are to agents that have many other agents sending links to them. The scientific name of this measure is hub centrality and it is calculated on agent by agent matrices.
Input network(s): Agent x Agent
Rank Agent Value 1 1 1.000 2 14 1.000 3 23 1.000 4 68 1.000 5 89 1.000 6 93 1.000 7 97 1.000 8 98 1.000 9 131 1.000 10 146 1.000 Authority centrality
A node is authority-central to the extent that its in-links are from nodes that have many out-links. Individuals or organizations that act as authorities are receiving information from a wide range of others each of whom sends information to a large number of others. Technically, an agent is authority-central if its in-links are from agents that have are sending links to many others. The scientific name of this measure is authority centrality and it is calculated on agent by agent matrices.
Input network(s): Agent x Agent
Rank Agent Value 1 1 1.000 2 14 1.000 3 23 1.000 4 68 1.000 5 89 1.000 6 93 1.000 7 97 1.000 8 98 1.000 9 131 1.000 10 146 1.000 Information centrality
Calculate the Stephenson and Zelen information centrality measure for each node.
Input network(s): Agent x Agent
Rank Agent Value 1 5 0.008 2 125 0.008 3 71 0.008 4 180 0.008 5 198 0.008 6 19 0.008 7 204 0.008 8 112 0.008 9 200 0.008 10 144 0.008 Clique membership count
The number of distinct cliques to which each node belongs. Individuals or organizations who are high in number of cliques are those that belong to a large number of distinct cliques. A clique is defined as a group of three or more actors that have many connections to each other and relatively fewer connections to those in other groups. The scientific name of this measure is clique count and it is calculated on the agent by agent matrices.
Input network(s): Agent x Agent
Rank Agent Value 1 1 7.000 2 123 7.000 3 22 6.000 4 55 6.000 5 87 6.000 6 96 6.000 7 189 6.000 8 47 5.000 9 64 4.000 10 139 4.000 Simmelian ties
The normalized number of Simmelian ties of each node.
Input network(s): Agent x Agent
Rank Agent Value Unscaled 1 1 0.044 9.000 2 87 0.044 9.000 3 55 0.039 8.000 4 96 0.034 7.000 5 160 0.034 7.000 6 189 0.034 7.000 7 22 0.029 6.000 8 25 0.029 6.000 9 47 0.029 6.000 10 123 0.029 6.000 Clustering coefficient
Measures the degree of clustering in a network by averaging the clustering coefficient of each node, which is defined as the density of the node's ego network.
Input network(s): Agent x Agent
Rank Agent Value 1 8 0.500 2 92 0.500 3 99 0.500 4 164 0.500 5 157 0.400 6 173 0.400 7 11 0.333 8 29 0.333 9 31 0.333 10 43 0.333
Key Nodes Table
This shows the top scoring nodes side-by-side for selected measures.
Rank Betweenness centrality Closeness centrality Eigenvector centrality In-degree centrality Out-degree centrality Total degree centrality 1 1 1 1 1 1 1 2 165 58 17 87 87 87 3 149 161 27 47 47 47 4 58 160 36 55 55 55 5 123 124 38 160 160 160 6 178 149 57 25 25 25 7 160 165 89 96 96 96 8 47 140 90 123 123 123 9 161 123 103 189 189 189 10 124 178 117 22 22 22