Calculates common social network measures on each selected input network.
Network test
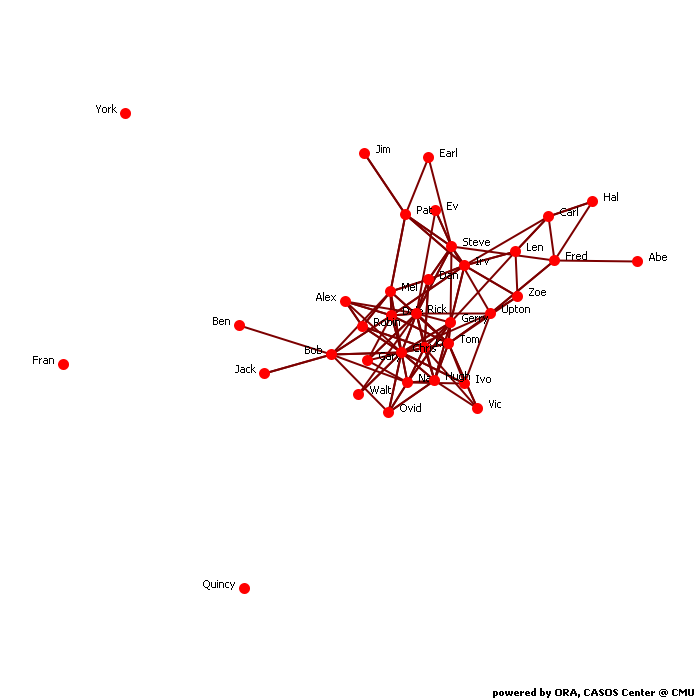
Network Level Measures
Measure Value Row count 36.000 Column count 36.000 Link count 147.000 Density 0.117 Components of 1 node (isolates) 3 Components of 2 nodes (dyadic isolates) 0 Components of 3 or more nodes 1 Reciprocity 0.615 Characteristic path length 2.543 Clustering coefficient 0.365 Network levels (diameter) 6.000 Network fragmentation 0.162 Krackhardt connectedness 0.838 Krackhardt efficiency 0.881 Krackhardt hierarchy 0.171 Krackhardt upperboundedness 0.994 Degree centralization 0.300 Betweenness centralization 0.141 Closeness centralization 0.037 Eigenvector centralization 0.416 Reciprocal (symmetric)? No (61% of the links are reciprocal)
Node Level Measures
Measure Min Max Avg Stddev Total degree centrality 0.000 0.400 0.117 0.094 Total degree centrality [Unscaled] 0.000 28.000 8.167 6.547 In-degree centrality 0.000 0.343 0.117 0.097 In-degree centrality [Unscaled] 0.000 12.000 4.083 3.378 Out-degree centrality 0.000 0.457 0.117 0.095 Out-degree centrality [Unscaled] 0.000 16.000 4.083 3.320 Eigenvector centrality 0.000 0.575 0.182 0.150 Eigenvector centrality [Unscaled] 0.000 0.407 0.129 0.106 Eigenvector centrality per component 0.000 0.373 0.118 0.097 Closeness centrality 0.028 0.132 0.114 0.027 Closeness centrality [Unscaled] 0.001 0.004 0.003 0.001 In-Closeness centrality 0.028 0.208 0.160 0.061 In-Closeness centrality [Unscaled] 0.001 0.006 0.005 0.002 Betweenness centrality 0.000 0.171 0.035 0.044 Betweenness centrality [Unscaled] 0.000 203.900 41.139 52.805 Hub centrality 0.000 0.673 0.174 0.159 Authority centrality 0.000 0.510 0.174 0.159 Information centrality 0.000 0.047 0.028 0.012 Information centrality [Unscaled] 0.000 2.171 1.286 0.562 Clique membership count 0.000 17.000 3.167 3.468 Simmelian ties 0.000 0.286 0.057 0.075 Simmelian ties [Unscaled] 0.000 10.000 2.000 2.614 Clustering coefficient 0.000 1.000 0.365 0.296
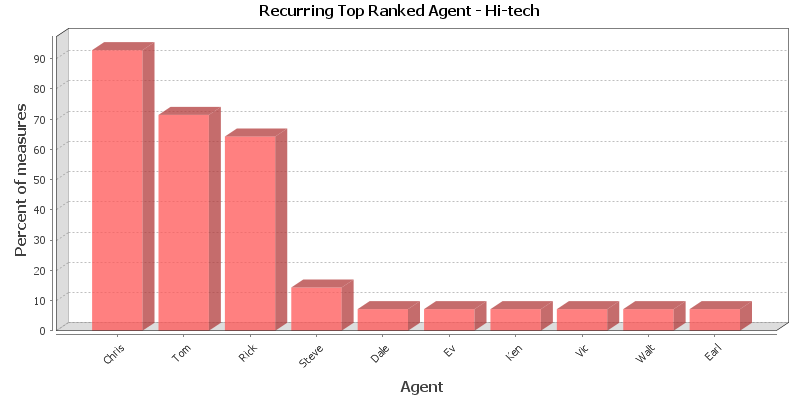
Key Nodes
This chart shows the Agent that is repeatedly top-ranked in the measures listed below. The value shown is the percentage of measures for which the Agent was ranked in the top three.
Total degree centrality
The Total Degree Centrality of a node is the normalized sum of its row and column degrees. Individuals or organizations who are "in the know" are those who are linked to many others and so, by virtue of their position have access to the ideas, thoughts, beliefs of many others. Individuals who are "in the know" are identified by degree centrality in the relevant social network. Those who are ranked high on this metrics have more connections to others in the same network. The scientific name of this measure is total degree centrality and it is calculated on the agent by agent matrices.
Input network: test (size: 36, density: 0.116667)
Rank Agent Value Unscaled Context* 1 Chris 0.400 28.000 5.296 2 Tom 0.286 20.000 3.160 3 Rick 0.286 20.000 3.160 4 Ken 0.229 16.000 2.092 5 Dale 0.214 15.000 1.825 6 Gerry 0.214 15.000 1.825 7 Irv 0.214 15.000 1.825 8 Steve 0.200 14.000 1.558 9 Mel 0.186 13.000 1.291 10 Hugh 0.186 13.000 1.291 * Number of standard deviations from the mean of a random network of the same size and density
Mean: 0.117 Mean in random network: 0.117 Std.dev: 0.094 Std.dev in random network: 0.054 In-degree centrality
The In Degree Centrality of a node is its normalized in-degree. For any node, e.g. an individual or a resource, the in-links are the connections that the node of interest receives from other nodes. For example, imagine an agent by knowledge matrix then the number of in-links a piece of knowledge has is the number of agents that are connected to. The scientific name of this measure is in-degree and it is calculated on the agent by agent matrices.
Input network(s): test
Rank Agent Value Unscaled 1 Chris 0.343 12.000 2 Rick 0.314 11.000 3 Tom 0.286 10.000 4 Ken 0.257 9.000 5 Dale 0.229 8.000 6 Steve 0.229 8.000 7 Gerry 0.229 8.000 8 Irv 0.229 8.000 9 Bob 0.171 6.000 10 Mel 0.171 6.000 Out-degree centrality
For any node, e.g. an individual or a resource, the out-links are the connections that the node of interest sends to other nodes. For example, imagine an agent by knowledge matrix then the number of out-links an agent would have is the number of pieces of knowledge it is connected to. The scientific name of this measure is out-degree and it is calculated on the agent by agent matrices. Individuals or organizations who are high in most knowledge have more expertise or are associated with more types of knowledge than are others. If no sub-network connecting agents to knowledge exists, then this measure will not be calculated. The scientific name of this measure is out degree centrality and it is calculated on agent by knowledge matrices. Individuals or organizations who are high in "most resources" have more resources or are associated with more types of resources than are others. If no sub-network connecting agents to resources exists, then this measure will not be calculated. The scientific name of this measure is out degree centrality and it is calculated on agent by resource matrices.
Input network(s): test
Rank Agent Value Unscaled 1 Chris 0.457 16.000 2 Tom 0.286 10.000 3 Rick 0.257 9.000 4 Dale 0.200 7.000 5 Ken 0.200 7.000 6 Mel 0.200 7.000 7 Nan 0.200 7.000 8 Gerry 0.200 7.000 9 Hugh 0.200 7.000 10 Irv 0.200 7.000 Eigenvector centrality
Calculates the principal eigenvector of the network. A node is central to the extent that its neighbors are central. Leaders of strong cliques are individuals who or organizations who are collected to others that are themselves highly connected to each other. In other words, if you have a clique then the individual most connected to others in the clique and other cliques, is the leader of the clique. Individuals or organizations who are connected to many otherwise isolated individuals or organizations will have a much lower score in this measure then those that are connected to groups that have many connections themselves. The scientific name of this measure is eigenvector centrality and it is calculated on agent by agent matrices.
Input network: test (size: 36, density: 0.116667)
Rank Agent Value Unscaled Context* 1 Chris 0.575 0.407 0.460 2 Rick 0.480 0.340 0.113 3 Tom 0.445 0.314 -0.018 4 Ken 0.391 0.276 -0.215 5 Gerry 0.389 0.275 -0.221 6 Hugh 0.370 0.262 -0.291 7 Dale 0.323 0.229 -0.462 8 Nan 0.320 0.227 -0.474 9 Upton 0.268 0.189 -0.666 10 Mel 0.255 0.180 -0.714 * Number of standard deviations from the mean of a random network of the same size and density
Mean: 0.182 Mean in random network: 0.450 Std.dev: 0.150 Std.dev in random network: 0.273 Eigenvector centrality per component
Calculates the principal eigenvector of the network. A node is central to the extent that its neighbors are central. Each component is extracted as a separate network, Eigenvector Centrality is computed on it and scaled according to the component size. The scores are then combined into a single result vector.
Input network(s): test
Rank Agent Value 1 Chris 0.373 2 Rick 0.311 3 Tom 0.288 4 Ken 0.253 5 Gerry 0.252 6 Hugh 0.240 7 Dale 0.210 8 Nan 0.208 9 Upton 0.174 10 Mel 0.165 Closeness centrality
The average closeness of a node to the other nodes in a network (also called out-closeness). Loosely, Closeness is the inverse of the average distance in the network from the node to all other nodes.
Input network: test (size: 36, density: 0.116667)
Rank Agent Value Unscaled Context* 1 Chris 0.132 0.004 -3.501 2 Earl 0.130 0.004 -3.531 3 Dale 0.129 0.004 -3.554 4 Tom 0.129 0.004 -3.554 5 Rick 0.128 0.004 -3.561 6 Gerry 0.128 0.004 -3.561 7 Mel 0.127 0.004 -3.576 8 Irv 0.127 0.004 -3.583 9 Hugh 0.126 0.004 -3.597 10 Ken 0.125 0.004 -3.604 * Number of standard deviations from the mean of a random network of the same size and density
Mean: 0.114 Mean in random network: 0.357 Std.dev: 0.027 Std.dev in random network: 0.064 In-Closeness centrality
The average closeness of a node from the other nodes in a network. Loosely, Closeness is the inverse of the average distance in the network to the node and from all other nodes.
Input network(s): test
Rank Agent Value Unscaled 1 Rick 0.208 0.006 2 Tom 0.206 0.006 3 Chris 0.206 0.006 4 Dale 0.205 0.006 5 Gerry 0.205 0.006 6 Irv 0.203 0.006 7 Steve 0.201 0.006 8 Upton 0.201 0.006 9 Ken 0.198 0.006 10 Mel 0.198 0.006 Betweenness centrality
The Betweenness Centrality of node v in a network is defined as: across all node pairs that have a shortest path containing v, the percentage that pass through v. Individuals or organizations that are potentially influential are positioned to broker connections between groups and to bring to bear the influence of one group on another or serve as a gatekeeper between groups. This agent occurs on many of the shortest paths between other agents. The scientific name of this measure is betweenness centrality and it is calculated on agent by agent matrices.
Input network: test (size: 36, density: 0.116667)
Rank Agent Value Unscaled Context* 1 Chris 0.171 203.900 3.475 2 Irv 0.142 169.187 2.643 3 Steve 0.105 124.702 1.577 4 Rick 0.091 108.648 1.192 5 Tom 0.088 104.753 1.099 6 Dale 0.085 101.620 1.024 7 Bob 0.076 90.800 0.765 8 Gerry 0.075 89.149 0.725 9 Pat 0.064 75.932 0.408 10 Mel 0.063 75.163 0.390 * Number of standard deviations from the mean of a random network of the same size and density
Mean: 0.035 Mean in random network: 0.049 Std.dev: 0.044 Std.dev in random network: 0.035 Hub centrality
A node is hub-central to the extent that its out-links are to nodes that have many in-links. Individuals or organizations that act as hubs are sending information to a wide range of others each of whom has many others reporting to them. Technically, an agent is hub-central if its out-links are to agents that have many other agents sending links to them. The scientific name of this measure is hub centrality and it is calculated on agent by agent matrices.
Input network(s): test
Rank Agent Value 1 Chris 0.673 2 Tom 0.471 3 Hugh 0.413 4 Gerry 0.402 5 Rick 0.391 6 Dale 0.349 7 Ken 0.348 8 Nan 0.316 9 Mel 0.305 10 Dan 0.240 Authority centrality
A node is authority-central to the extent that its in-links are from nodes that have many out-links. Individuals or organizations that act as authorities are receiving information from a wide range of others each of whom sends information to a large number of others. Technically, an agent is authority-central if its in-links are from agents that have are sending links to many others. The scientific name of this measure is authority centrality and it is calculated on agent by agent matrices.
Input network(s): test
Rank Agent Value 1 Rick 0.510 2 Chris 0.498 3 Tom 0.479 4 Ken 0.475 5 Gerry 0.396 6 Dale 0.357 7 Hugh 0.322 8 Mel 0.294 9 Nan 0.287 10 Bob 0.247 Information centrality
Calculate the Stephenson and Zelen information centrality measure for each node.
Input network(s): test
Rank Agent Value Unscaled 1 Chris 0.047 2.171 2 Tom 0.043 1.993 3 Rick 0.043 1.972 4 Gerry 0.040 1.850 5 Mel 0.040 1.842 6 Nan 0.040 1.836 7 Dale 0.039 1.824 8 Hugh 0.039 1.824 9 Ken 0.039 1.804 10 Irv 0.039 1.789 Clique membership count
The number of distinct cliques to which each node belongs. Individuals or organizations who are high in number of cliques are those that belong to a large number of distinct cliques. A clique is defined as a group of three or more actors that have many connections to each other and relatively fewer connections to those in other groups. The scientific name of this measure is clique count and it is calculated on the agent by agent matrices.
Input network(s): test
Rank Agent Value 1 Chris 17.000 2 Rick 11.000 3 Steve 9.000 4 Tom 7.000 5 Irv 6.000 6 Dale 5.000 7 Ken 5.000 8 Nan 5.000 9 Upton 5.000 10 Gerry 5.000 Simmelian ties
The normalized number of Simmelian ties of each node.
Input network(s): test
Rank Agent Value Unscaled 1 Chris 0.286 10.000 2 Tom 0.200 7.000 3 Ken 0.171 6.000 4 Rick 0.171 6.000 5 Dale 0.143 5.000 6 Gerry 0.143 5.000 7 Hugh 0.143 5.000 8 Mel 0.114 4.000 9 Nan 0.114 4.000 10 Steve 0.114 4.000 Clustering coefficient
Measures the degree of clustering in a network by averaging the clustering coefficient of each node, which is defined as the density of the node's ego network.
Input network(s): test
Rank Agent Value 1 Ev 1.000 2 Vic 1.000 3 Walt 1.000 4 Earl 1.000 5 Gary 0.667 6 Ovid 0.667 7 Alex 0.667 8 Ivo 0.583 9 Hugh 0.554 10 Hal 0.500
Key Nodes Table
This shows the top scoring nodes side-by-side for selected measures.
Rank Betweenness centrality Closeness centrality Eigenvector centrality Eigenvector centrality per component In-degree centrality In-Closeness centrality Out-degree centrality Total degree centrality 1 Chris Chris Chris Chris Chris Rick Chris Chris 2 Irv Earl Rick Rick Rick Tom Tom Tom 3 Steve Dale Tom Tom Tom Chris Rick Rick 4 Rick Tom Ken Ken Ken Dale Dale Ken 5 Tom Rick Gerry Gerry Dale Gerry Ken Dale 6 Dale Gerry Hugh Hugh Steve Irv Mel Gerry 7 Bob Mel Dale Dale Gerry Steve Nan Irv 8 Gerry Irv Nan Nan Irv Upton Gerry Steve 9 Pat Hugh Upton Upton Bob Ken Hugh Mel 10 Mel Ken Mel Mel Mel Mel Irv Hugh