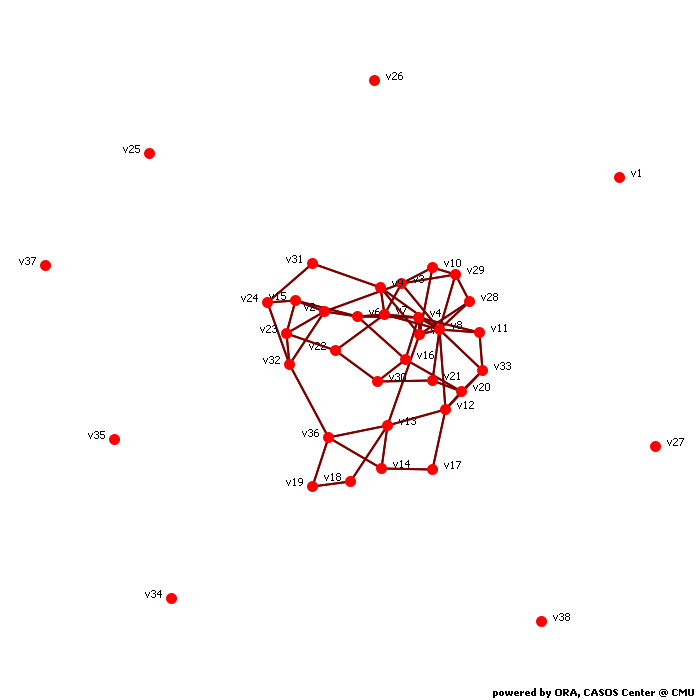
Calculates common social network measures on each selected input network.
Network test
Network Level Measures
Measure Value Row count 38.000 Column count 38.000 Link count 61.000 Density 0.087 Components of 1 node (isolates) 8 Components of 2 nodes (dyadic isolates) 0 Components of 3 or more nodes 1 Reciprocity 1.000 Characteristic path length 2.644 Clustering coefficient 0.181 Network levels (diameter) 5.000 Network fragmentation 0.381 Krackhardt connectedness 0.619 Krackhardt efficiency 0.921 Krackhardt hierarchy 0.000 Krackhardt upperboundedness 1.000 Degree centralization 0.222 Betweenness centralization 0.139 Closeness centralization 0.043 Eigenvector centralization 0.557 Reciprocal (symmetric)? Yes
Node Level Measures
Measure Min Max Avg Stddev Total degree centrality 0.000 0.297 0.087 0.061 Total degree centrality [Unscaled] 0.000 11.000 3.211 2.261 In-degree centrality 0.000 0.297 0.087 0.061 In-degree centrality [Unscaled] 0.000 11.000 3.211 2.261 Out-degree centrality 0.000 0.297 0.087 0.061 Out-degree centrality [Unscaled] 0.000 11.000 3.211 2.261 Eigenvector centrality 0.000 0.693 0.166 0.159 Eigenvector centrality [Unscaled] 0.000 0.490 0.117 0.112 Eigenvector centrality per component 0.000 0.387 0.092 0.089 Closeness centrality 0.026 0.103 0.082 0.029 Closeness centrality [Unscaled] 0.001 0.003 0.002 0.001 In-Closeness centrality 0.026 0.103 0.082 0.029 In-Closeness centrality [Unscaled] 0.001 0.003 0.002 0.001 Betweenness centrality 0.000 0.163 0.028 0.035 Betweenness centrality [Unscaled] 0.000 108.874 18.816 23.274 Hub centrality 0.000 0.693 0.166 0.159 Authority centrality 0.000 0.693 0.166 0.159 Information centrality 0.000 0.051 0.026 0.015 Information centrality [Unscaled] 0.000 2.207 1.136 0.647 Clique membership count 0.000 11.000 1.500 2.062 Simmelian ties 0.000 0.270 0.055 0.060 Simmelian ties [Unscaled] 0.000 10.000 2.053 2.224 Clustering coefficient 0.000 0.667 0.181 0.192
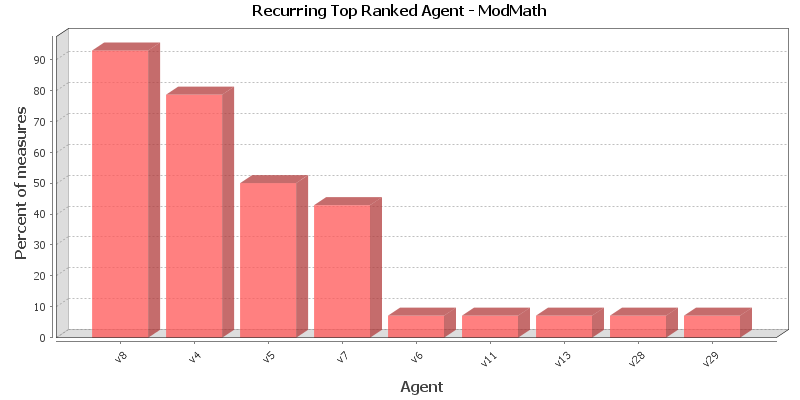
Key Nodes
This chart shows the Agent that is repeatedly top-ranked in the measures listed below. The value shown is the percentage of measures for which the Agent was ranked in the top three.
Total degree centrality
The Total Degree Centrality of a node is the normalized sum of its row and column degrees. Individuals or organizations who are "in the know" are those who are linked to many others and so, by virtue of their position have access to the ideas, thoughts, beliefs of many others. Individuals who are "in the know" are identified by degree centrality in the relevant social network. Those who are ranked high on this metrics have more connections to others in the same network. The scientific name of this measure is total degree centrality and it is calculated on the agent by agent matrices.
Input network: test (size: 38, density: 0.086771)
Rank Agent Value Unscaled Context* 1 v8 0.297 11.000 4.610 2 v4 0.162 6.000 1.651 3 v5 0.162 6.000 1.651 4 v7 0.162 6.000 1.651 5 v2 0.135 5.000 1.059 6 v3 0.135 5.000 1.059 7 v6 0.135 5.000 1.059 8 v12 0.135 5.000 1.059 9 v13 0.135 5.000 1.059 10 v9 0.108 4.000 0.467 * Number of standard deviations from the mean of a random network of the same size and density
Mean: 0.087 Mean in random network: 0.087 Std.dev: 0.061 Std.dev in random network: 0.046 In-degree centrality
The In Degree Centrality of a node is its normalized in-degree. For any node, e.g. an individual or a resource, the in-links are the connections that the node of interest receives from other nodes. For example, imagine an agent by knowledge matrix then the number of in-links a piece of knowledge has is the number of agents that are connected to. The scientific name of this measure is in-degree and it is calculated on the agent by agent matrices.
Input network(s): test
Rank Agent Value Unscaled 1 v8 0.297 11.000 2 v4 0.162 6.000 3 v5 0.162 6.000 4 v7 0.162 6.000 5 v2 0.135 5.000 6 v3 0.135 5.000 7 v6 0.135 5.000 8 v12 0.135 5.000 9 v13 0.135 5.000 10 v9 0.108 4.000 Out-degree centrality
For any node, e.g. an individual or a resource, the out-links are the connections that the node of interest sends to other nodes. For example, imagine an agent by knowledge matrix then the number of out-links an agent would have is the number of pieces of knowledge it is connected to. The scientific name of this measure is out-degree and it is calculated on the agent by agent matrices. Individuals or organizations who are high in most knowledge have more expertise or are associated with more types of knowledge than are others. If no sub-network connecting agents to knowledge exists, then this measure will not be calculated. The scientific name of this measure is out degree centrality and it is calculated on agent by knowledge matrices. Individuals or organizations who are high in "most resources" have more resources or are associated with more types of resources than are others. If no sub-network connecting agents to resources exists, then this measure will not be calculated. The scientific name of this measure is out degree centrality and it is calculated on agent by resource matrices.
Input network(s): test
Rank Agent Value Unscaled 1 v8 0.297 11.000 2 v4 0.162 6.000 3 v5 0.162 6.000 4 v7 0.162 6.000 5 v2 0.135 5.000 6 v3 0.135 5.000 7 v6 0.135 5.000 8 v12 0.135 5.000 9 v13 0.135 5.000 10 v9 0.108 4.000 Eigenvector centrality
Calculates the principal eigenvector of the network. A node is central to the extent that its neighbors are central. Leaders of strong cliques are individuals who or organizations who are collected to others that are themselves highly connected to each other. In other words, if you have a clique then the individual most connected to others in the clique and other cliques, is the leader of the clique. Individuals or organizations who are connected to many otherwise isolated individuals or organizations will have a much lower score in this measure then those that are connected to groups that have many connections themselves. The scientific name of this measure is eigenvector centrality and it is calculated on agent by agent matrices.
Input network: test (size: 38, density: 0.086771)
Rank Agent Value Unscaled Context* 1 v8 0.693 0.490 1.064 2 v4 0.444 0.314 0.149 3 v7 0.429 0.304 0.093 4 v5 0.410 0.290 0.024 5 v3 0.354 0.250 -0.185 6 v9 0.314 0.222 -0.331 7 v29 0.299 0.212 -0.385 8 v33 0.279 0.197 -0.462 9 v11 0.277 0.196 -0.467 10 v28 0.274 0.194 -0.476 * Number of standard deviations from the mean of a random network of the same size and density
Mean: 0.166 Mean in random network: 0.404 Std.dev: 0.159 Std.dev in random network: 0.272 Eigenvector centrality per component
Calculates the principal eigenvector of the network. A node is central to the extent that its neighbors are central. Each component is extracted as a separate network, Eigenvector Centrality is computed on it and scaled according to the component size. The scores are then combined into a single result vector.
Input network(s): test
Rank Agent Value 1 v8 0.387 2 v4 0.248 3 v7 0.240 4 v5 0.229 5 v3 0.197 6 v9 0.175 7 v29 0.167 8 v33 0.155 9 v11 0.155 10 v28 0.153 Closeness centrality
The average closeness of a node to the other nodes in a network (also called out-closeness). Loosely, Closeness is the inverse of the average distance in the network from the node to all other nodes.
Input network: test (size: 38, density: 0.086771)
Rank Agent Value Unscaled Context* 1 v8 0.103 0.003 -3.424 2 v4 0.101 0.003 -3.454 3 v5 0.101 0.003 -3.459 4 v7 0.100 0.003 -3.474 5 v3 0.100 0.003 -3.479 6 v9 0.100 0.003 -3.479 7 v12 0.100 0.003 -3.479 8 v2 0.099 0.003 -3.493 9 v6 0.099 0.003 -3.493 10 v13 0.099 0.003 -3.493 * Number of standard deviations from the mean of a random network of the same size and density
Mean: 0.082 Mean in random network: 0.295 Std.dev: 0.029 Std.dev in random network: 0.056 In-Closeness centrality
The average closeness of a node from the other nodes in a network. Loosely, Closeness is the inverse of the average distance in the network to the node and from all other nodes.
Input network(s): test
Rank Agent Value Unscaled 1 v8 0.103 0.003 2 v4 0.101 0.003 3 v5 0.101 0.003 4 v7 0.100 0.003 5 v3 0.100 0.003 6 v9 0.100 0.003 7 v12 0.100 0.003 8 v2 0.099 0.003 9 v6 0.099 0.003 10 v13 0.099 0.003 Betweenness centrality
The Betweenness Centrality of node v in a network is defined as: across all node pairs that have a shortest path containing v, the percentage that pass through v. Individuals or organizations that are potentially influential are positioned to broker connections between groups and to bring to bear the influence of one group on another or serve as a gatekeeper between groups. This agent occurs on many of the shortest paths between other agents. The scientific name of this measure is betweenness centrality and it is calculated on agent by agent matrices.
Input network: test (size: 38, density: 0.086771)
Rank Agent Value Unscaled Context* 1 v8 0.163 108.874 1.100 2 v13 0.105 69.614 0.514 3 v5 0.086 57.060 0.326 4 v12 0.076 50.549 0.229 5 v36 0.068 45.464 0.153 6 v32 0.063 41.884 0.100 7 v2 0.051 34.208 -0.015 8 v4 0.048 32.154 -0.045 9 v7 0.048 31.801 -0.051 10 v3 0.048 31.694 -0.052 * Number of standard deviations from the mean of a random network of the same size and density
Mean: 0.028 Mean in random network: 0.053 Std.dev: 0.035 Std.dev in random network: 0.101 Hub centrality
A node is hub-central to the extent that its out-links are to nodes that have many in-links. Individuals or organizations that act as hubs are sending information to a wide range of others each of whom has many others reporting to them. Technically, an agent is hub-central if its out-links are to agents that have many other agents sending links to them. The scientific name of this measure is hub centrality and it is calculated on agent by agent matrices.
Input network(s): test
Rank Agent Value 1 v8 0.693 2 v4 0.444 3 v7 0.429 4 v5 0.410 5 v3 0.354 6 v9 0.314 7 v29 0.299 8 v33 0.279 9 v11 0.277 10 v28 0.274 Authority centrality
A node is authority-central to the extent that its in-links are from nodes that have many out-links. Individuals or organizations that act as authorities are receiving information from a wide range of others each of whom sends information to a large number of others. Technically, an agent is authority-central if its in-links are from agents that have are sending links to many others. The scientific name of this measure is authority centrality and it is calculated on agent by agent matrices.
Input network(s): test
Rank Agent Value 1 v8 0.693 2 v4 0.444 3 v7 0.429 4 v5 0.410 5 v3 0.354 6 v9 0.314 7 v29 0.299 8 v33 0.279 9 v11 0.277 10 v28 0.274 Information centrality
Calculate the Stephenson and Zelen information centrality measure for each node.
Input network(s): test
Rank Agent Value Unscaled 1 v8 0.051 2.207 2 v7 0.043 1.871 3 v5 0.043 1.867 4 v4 0.043 1.861 5 v6 0.040 1.709 6 v3 0.039 1.701 7 v12 0.039 1.676 8 v2 0.038 1.629 9 v9 0.036 1.566 10 v13 0.036 1.547 Clique membership count
The number of distinct cliques to which each node belongs. Individuals or organizations who are high in number of cliques are those that belong to a large number of distinct cliques. A clique is defined as a group of three or more actors that have many connections to each other and relatively fewer connections to those in other groups. The scientific name of this measure is clique count and it is calculated on the agent by agent matrices.
Input network(s): test
Rank Agent Value 1 v8 11.000 2 v4 5.000 3 v7 4.000 4 v2 3.000 5 v3 3.000 6 v5 3.000 7 v6 3.000 8 v29 3.000 9 v33 3.000 10 v9 2.000 Simmelian ties
The normalized number of Simmelian ties of each node.
Input network(s): test
Rank Agent Value Unscaled 1 v8 0.270 10.000 2 v4 0.162 6.000 3 v6 0.135 5.000 4 v7 0.135 5.000 5 v2 0.108 4.000 6 v3 0.108 4.000 7 v5 0.108 4.000 8 v29 0.108 4.000 9 v33 0.108 4.000 10 v9 0.081 3.000 Clustering coefficient
Measures the degree of clustering in a network by averaging the clustering coefficient of each node, which is defined as the density of the node's ego network.
Input network(s): test
Rank Agent Value 1 v11 0.667 2 v28 0.667 3 v29 0.500 4 v33 0.500 5 v4 0.333 6 v9 0.333 7 v10 0.333 8 v14 0.333 9 v15 0.333 10 v23 0.333
Key Nodes Table
This shows the top scoring nodes side-by-side for selected measures.
Rank Betweenness centrality Closeness centrality Eigenvector centrality Eigenvector centrality per component In-degree centrality In-Closeness centrality Out-degree centrality Total degree centrality 1 v8 v8 v8 v8 v8 v8 v8 v8 2 v13 v4 v4 v4 v4 v4 v4 v4 3 v5 v5 v7 v7 v5 v5 v5 v5 4 v12 v7 v5 v5 v7 v7 v7 v7 5 v36 v3 v3 v3 v2 v3 v2 v2 6 v32 v9 v9 v9 v3 v9 v3 v3 7 v2 v12 v29 v29 v6 v12 v6 v6 8 v4 v2 v33 v33 v12 v2 v12 v12 9 v7 v6 v11 v11 v13 v6 v13 v13 10 v3 v13 v28 v28 v9 v13 v9 v9