Block Model - Newman's Clustering Algorithm
Network Level Measures
Measure Value Row count 812.000 Column count 812.000 Link count 2652.000 Density 0.004 Components of 1 node (isolates) 89 Components of 2 nodes (dyadic isolates) 0 Components of 3 or more nodes 1 Reciprocity 0.062 Characteristic path length 3.639 Clustering coefficient 0.287 Network levels (diameter) 9.000 Network fragmentation 0.207 Krackhardt connectedness 0.793 Krackhardt efficiency 0.993 Krackhardt hierarchy 0.677 Krackhardt upperboundedness 0.767 Degree centralization 0.061 Betweenness centralization 0.057 Closeness centralization 0.000 Eigenvector centralization 0.285 Reciprocal (symmetric)? No (6% of the links are reciprocal)
Node Level Measures
Measure Min Max Avg Stddev Total degree centrality 0.000 0.065 0.004 0.008 Total degree centrality [Unscaled] 0.000 106.000 6.475 13.308 In-degree centrality 0.000 0.086 0.004 0.010 In-degree centrality [Unscaled] 0.000 70.000 3.266 7.858 Out-degree centrality 0.000 0.091 0.004 0.008 Out-degree centrality [Unscaled] 0.000 74.000 3.266 6.533 Eigenvector centrality 0.000 0.308 0.024 0.043 Eigenvector centrality [Unscaled] 0.000 0.218 0.017 0.031 Eigenvector centrality per component 0.000 0.194 0.015 0.027 Closeness centrality 0.001 0.002 0.002 0.000 Closeness centrality [Unscaled] 0.000 0.000 0.000 0.000 In-Closeness centrality 0.001 0.009 0.005 0.004 In-Closeness centrality [Unscaled] 0.000 0.000 0.000 0.000 Betweenness centrality 0.000 0.059 0.001 0.005 Betweenness centrality [Unscaled] 0.000 38559.629 860.673 3091.065 Hub centrality 0.000 0.437 0.023 0.044 Authority centrality 0.000 0.400 0.020 0.046 Information centrality 0.000 0.003 0.001 0.001 Information centrality [Unscaled] 0.000 1.616 0.746 0.402 Clique membership count 0.000 260.000 6.395 24.841 Simmelian ties 0.000 0.011 0.000 0.001 Simmelian ties [Unscaled] 0.000 9.000 0.076 0.591 Clustering coefficient 0.000 1.000 0.287 0.358
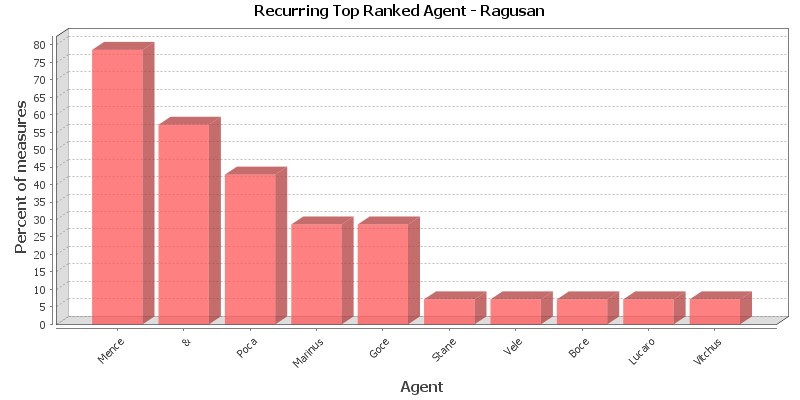
Key Nodes
This chart shows the Agent that is repeatedly top-ranked in the measures listed below. The value shown is the percentage of measures for which the Agent was ranked in the top three.
Total degree centrality
The Total Degree Centrality of a node is the normalized sum of its row and column degrees. Individuals or organizations who are "in the know" are those who are linked to many others and so, by virtue of their position have access to the ideas, thoughts, beliefs of many others. Individuals who are "in the know" are identified by degree centrality in the relevant social network. Those who are ranked high on this metrics have more connections to others in the same network. The scientific name of this measure is total degree centrality and it is calculated on the agent by agent matrices.
Input network: Son (size: 812, density: 0.00402218)
Rank Agent Value Unscaled Context* 1 Poca 0.065 106.000 27.593 2 Mence 0.065 105.000 27.316 3 & 0.064 104.000 27.039 4 Marinus 0.060 98.000 25.374 5 Caboga 0.052 85.000 21.768 6 Goce 0.049 79.000 20.104 7 Nicola 0.047 77.000 19.549 8 Bincola 0.047 77.000 19.549 9 Resti 0.046 74.000 18.717 10 Luca 0.044 72.000 18.162 * Number of standard deviations from the mean of a random network of the same size and density
Mean: 0.004 Mean in random network: 0.004 Std.dev: 0.008 Std.dev in random network: 0.002 In-degree centrality
The In Degree Centrality of a node is its normalized in-degree. For any node, e.g. an individual or a resource, the in-links are the connections that the node of interest receives from other nodes. For example, imagine an agent by knowledge matrix then the number of in-links a piece of knowledge has is the number of agents that are connected to. The scientific name of this measure is in-degree and it is calculated on the agent by agent matrices.
Input network(s): Son
Rank Agent Value Unscaled 1 Poca 0.086 70.000 2 Mence 0.074 60.000 3 & 0.074 60.000 4 Caboga 0.071 58.000 5 Marinus 0.069 56.000 6 Bincola 0.065 53.000 7 Luca 0.058 47.000 8 Saraca 0.055 45.000 9 Basilio 0.054 44.000 10 Resti 0.052 42.000 Out-degree centrality
For any node, e.g. an individual or a resource, the out-links are the connections that the node of interest sends to other nodes. For example, imagine an agent by knowledge matrix then the number of out-links an agent would have is the number of pieces of knowledge it is connected to. The scientific name of this measure is out-degree and it is calculated on the agent by agent matrices. Individuals or organizations who are high in most knowledge have more expertise or are associated with more types of knowledge than are others. If no sub-network connecting agents to knowledge exists, then this measure will not be calculated. The scientific name of this measure is out degree centrality and it is calculated on agent by knowledge matrices. Individuals or organizations who are high in "most resources" have more resources or are associated with more types of resources than are others. If no sub-network connecting agents to resources exists, then this measure will not be calculated. The scientific name of this measure is out degree centrality and it is calculated on agent by resource matrices.
Input network(s): Son
Rank Agent Value Unscaled 1 Goce 0.091 74.000 2 Mence 0.057 46.000 3 & 0.055 45.000 4 Marinus 0.052 42.000 5 Nicola 0.049 40.000 6 Bona 0.049 40.000 7 Georgio 0.046 37.000 8 Poca 0.046 37.000 9 Zrieva 0.043 35.000 10 Petrus 0.041 33.000 Eigenvector centrality
Calculates the principal eigenvector of the network. A node is central to the extent that its neighbors are central. Leaders of strong cliques are individuals who or organizations who are collected to others that are themselves highly connected to each other. In other words, if you have a clique then the individual most connected to others in the clique and other cliques, is the leader of the clique. Individuals or organizations who are connected to many otherwise isolated individuals or organizations will have a much lower score in this measure then those that are connected to groups that have many connections themselves. The scientific name of this measure is eigenvector centrality and it is calculated on agent by agent matrices.
Input network: Son (size: 812, density: 0.00402218)
Rank Agent Value Unscaled Context* 1 Marinus 0.308 0.218 -0.705 2 Mence 0.305 0.216 -0.723 3 Poca 0.298 0.211 -0.773 4 & 0.293 0.207 -0.806 5 Goce 0.273 0.193 -0.940 6 Nicola 0.251 0.178 -1.083 7 Caboga 0.251 0.178 -1.084 8 Resti 0.214 0.151 -1.330 9 Petrus 0.212 0.150 -1.342 10 Basilio 0.204 0.145 -1.392 * Number of standard deviations from the mean of a random network of the same size and density
Mean: 0.024 Mean in random network: 0.415 Std.dev: 0.043 Std.dev in random network: 0.151 Eigenvector centrality per component
Calculates the principal eigenvector of the network. A node is central to the extent that its neighbors are central. Each component is extracted as a separate network, Eigenvector Centrality is computed on it and scaled according to the component size. The scores are then combined into a single result vector.
Input network(s): Son
Rank Agent Value 1 Marinus 0.194 2 Mence 0.192 3 Poca 0.188 4 & 0.184 5 Goce 0.172 6 Nicola 0.158 7 Caboga 0.158 8 Resti 0.135 9 Petrus 0.133 10 Basilio 0.129 Closeness centrality
The average closeness of a node to the other nodes in a network (also called out-closeness). Loosely, Closeness is the inverse of the average distance in the network from the node to all other nodes.
Input network: Son (size: 812, density: 0.00402218)
Rank Agent Value Unscaled Context* 1 Benessa 0.002 0.000 -5.745 2 Zamagna 0.002 0.000 -5.745 3 Lucaro 0.002 0.000 -5.745 4 Antonius 0.002 0.000 -5.745 5 Aloisio 0.002 0.000 -5.745 6 Sorento 0.002 0.000 -5.745 7 Marino 0.002 0.000 -5.745 8 Lucia 0.002 0.000 -5.745 9 Pusterna 0.002 0.000 -5.745 10 Nuce 0.002 0.000 -5.745 * Number of standard deviations from the mean of a random network of the same size and density
Mean: 0.002 Mean in random network: 0.131 Std.dev: 0.000 Std.dev in random network: 0.022 In-Closeness centrality
The average closeness of a node from the other nodes in a network. Loosely, Closeness is the inverse of the average distance in the network to the node and from all other nodes.
Input network(s): Son
Rank Agent Value Unscaled 1 Vitchus 0.009 0.000 2 Buona 0.009 0.000 3 Gaya 0.009 0.000 4 Katerina 0.009 0.000 5 Micha 0.009 0.000 6 Pasquich 0.009 0.000 7 Dragonis 0.009 0.000 8 Poca 0.009 0.000 9 Priasnus 0.009 0.000 10 & 0.009 0.000 Betweenness centrality
The Betweenness Centrality of node v in a network is defined as: across all node pairs that have a shortest path containing v, the percentage that pass through v. Individuals or organizations that are potentially influential are positioned to broker connections between groups and to bring to bear the influence of one group on another or serve as a gatekeeper between groups. This agent occurs on many of the shortest paths between other agents. The scientific name of this measure is betweenness centrality and it is calculated on agent by agent matrices.
Input network: Son (size: 812, density: 0.00402218)
Rank Agent Value Unscaled Context* 1 & 0.059 38559.629 0.205 2 Poca 0.048 31221.869 0.163 3 Mence 0.040 26486.406 0.136 4 Marinus 0.038 25152.096 0.128 5 Luca 0.028 18718.752 0.092 6 Caboga 0.028 18322.123 0.089 7 Nicola 0.028 18157.578 0.088 8 Bincola 0.027 17723.225 0.086 9 Resti 0.026 17112.330 0.082 10 Zrieva 0.019 12515.492 0.056 * Number of standard deviations from the mean of a random network of the same size and density
Mean: 0.001 Mean in random network: 0.004 Std.dev: 0.005 Std.dev in random network: 0.267 Hub centrality
A node is hub-central to the extent that its out-links are to nodes that have many in-links. Individuals or organizations that act as hubs are sending information to a wide range of others each of whom has many others reporting to them. Technically, an agent is hub-central if its out-links are to agents that have many other agents sending links to them. The scientific name of this measure is hub centrality and it is calculated on agent by agent matrices.
Input network(s): Son
Rank Agent Value 1 Goce 0.437 2 Mence 0.319 3 & 0.306 4 Nicola 0.299 5 Marinus 0.282 6 Petrus 0.243 7 Poca 0.234 8 Zrieva 0.228 9 Johannes 0.222 10 Ragnina 0.221 Authority centrality
A node is authority-central to the extent that its in-links are from nodes that have many out-links. Individuals or organizations that act as authorities are receiving information from a wide range of others each of whom sends information to a large number of others. Technically, an agent is authority-central if its in-links are from agents that have are sending links to many others. The scientific name of this measure is authority centrality and it is calculated on agent by agent matrices.
Input network(s): Son
Rank Agent Value 1 Poca 0.400 2 Mence 0.368 3 & 0.365 4 Caboga 0.351 5 Marinus 0.326 6 Basilio 0.264 7 Resti 0.234 8 Bincola 0.226 9 Grede 0.226 10 Nicola 0.212 Information centrality
Calculate the Stephenson and Zelen information centrality measure for each node.
Input network(s): Son
Rank Agent Value Unscaled 1 Goce 0.003 1.616 2 Mence 0.003 1.592 3 & 0.003 1.590 4 Marinus 0.003 1.587 5 Bona 0.003 1.586 6 Nicola 0.003 1.582 7 Georgio 0.003 1.581 8 Zrieva 0.003 1.575 9 Poca 0.003 1.575 10 Petrus 0.003 1.572 Clique membership count
The number of distinct cliques to which each node belongs. Individuals or organizations who are high in number of cliques are those that belong to a large number of distinct cliques. A clique is defined as a group of three or more actors that have many connections to each other and relatively fewer connections to those in other groups. The scientific name of this measure is clique count and it is calculated on the agent by agent matrices.
Input network(s): Son
Rank Agent Value 1 Mence 260.000 2 Marinus 249.000 3 Goce 243.000 4 & 236.000 5 Poca 226.000 6 Nicola 172.000 7 Caboga 163.000 8 Basilio 107.000 9 Resti 106.000 10 Bincola 104.000 Simmelian ties
The normalized number of Simmelian ties of each node.
Input network(s): Son
Rank Agent Value Unscaled 1 Mence 0.011 9.000 2 & 0.011 9.000 3 Marinus 0.005 4.000 4 Maria 0.005 4.000 5 Poca 0.005 4.000 6 Caboga 0.005 4.000 7 Petrus 0.004 3.000 8 Zrieva 0.004 3.000 9 Nicola 0.002 2.000 10 Jacobus 0.002 2.000 Clustering coefficient
Measures the degree of clustering in a network by averaging the clustering coefficient of each node, which is defined as the density of the node's ego network.
Input network(s): Son
Rank Agent Value 1 Stane 1.000 2 Vele 1.000 3 Boce 1.000 4 Michele 1.000 5 Ñore 1.000 6 Joannes 1.000 7 Russinus 1.000 8 Bune 1.000 9 Slava 1.000 10 Laurenzo 1.000
Key Nodes Table
This shows the top scoring nodes side-by-side for selected measures.
Rank Betweenness centrality Closeness centrality Eigenvector centrality Eigenvector centrality per component In-degree centrality In-Closeness centrality Out-degree centrality Total degree centrality 1 & Benessa Marinus Marinus Poca Vitchus Goce Poca 2 Poca Zamagna Mence Mence Mence Buona Mence Mence 3 Mence Lucaro Poca Poca & Gaya & & 4 Marinus Antonius & & Caboga Katerina Marinus Marinus 5 Luca Aloisio Goce Goce Marinus Micha Nicola Caboga 6 Caboga Sorento Nicola Nicola Bincola Pasquich Bona Goce 7 Nicola Marino Caboga Caboga Luca Dragonis Georgio Nicola 8 Bincola Lucia Resti Resti Saraca Poca Poca Bincola 9 Resti Pusterna Petrus Petrus Basilio Priasnus Zrieva Resti 10 Zrieva Nuce Basilio Basilio Resti & Petrus Luca