Calculates common social network measures on each selected input network.
Network test
Network Level Measures
Measure Value Row count 18.000 Column count 18.000 Link count 33.000 Density 0.108 Components of 1 node (isolates) 0 Components of 2 nodes (dyadic isolates) 0 Components of 3 or more nodes 1 Reciprocity 0.138 Characteristic path length -16777214.000 Clustering coefficient 0.182 Network levels (diameter) 2.000 Network fragmentation 0.000 Krackhardt connectedness 1.000 Krackhardt efficiency 0.912 Krackhardt hierarchy 0.845 Krackhardt upperboundedness 0.640 Degree centralization 0.121 Betweenness centralization -1.#IO Closeness centralization 0.000 Eigenvector centralization 0.746 Reciprocal (symmetric)? No (13% of the links are reciprocal)
Node Level Measures
Measure Min Max Avg Stddev Total degree centrality -0.029 0.118 0.010 0.039 Total degree centrality [Unscaled] -1.000 4.000 0.333 1.333 In-degree centrality -0.059 0.235 0.010 0.074 In-degree centrality [Unscaled] -1.000 4.000 0.167 1.258 Out-degree centrality 0.000 0.059 0.010 0.022 Out-degree centrality [Unscaled] 0.000 1.000 0.167 0.373 Eigenvector centrality -0.726 0.667 0.004 0.333 Eigenvector centrality [Unscaled] -0.513 0.472 0.003 0.236 Eigenvector centrality per component -0.513 0.472 0.003 0.236 Closeness centrality -0.000 -0.000 -0.000 0.000 Closeness centrality [Unscaled] 0.000 0.000 0.000 0.000 In-Closeness centrality -0.086 9570149208162304.000 1063351084559047.100 3007607319693205.500 In-Closeness centrality [Unscaled] -562949953421312.000 0.005 -62550063797591.109 176918077629012.120 Betweenness centrality 0.000 1.#IO 1.#IO -1.#IO Betweenness centrality [Unscaled] 0.000 1.#IO 1.#IO -1.#IO Hub centrality -0.530 0.530 0.027 0.332 Authority centrality -0.717 1.128 0.008 0.333 Information centrality 0.000 0.333 0.056 0.124 Information centrality [Unscaled] 0.000 1.180 0.197 0.440 Clique membership count 0.000 6.000 1.167 1.537 Simmelian ties 0.000 0.000 0.000 0.000 Simmelian ties [Unscaled] 0.000 0.000 0.000 0.000 Clustering coefficient 0.000 1.000 0.182 0.264
Key Nodes
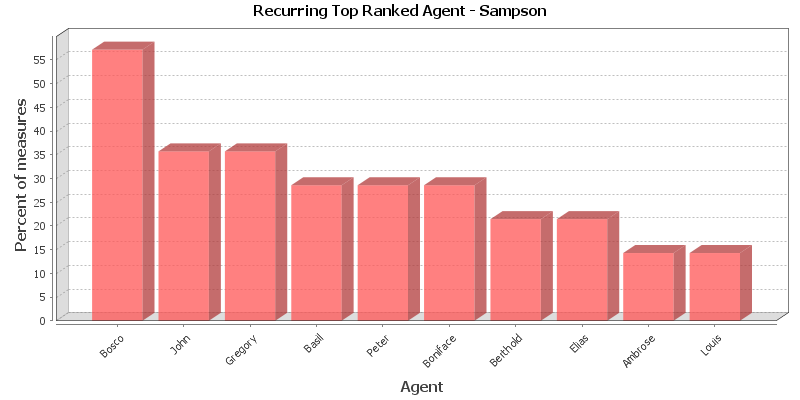
This chart shows the Agent that is repeatedly top-ranked in the measures listed below. The value shown is the percentage of measures for which the Agent was ranked in the top three.
Total degree centrality
The Total Degree Centrality of a node is the normalized sum of its row and column degrees. Individuals or organizations who are "in the know" are those who are linked to many others and so, by virtue of their position have access to the ideas, thoughts, beliefs of many others. Individuals who are "in the know" are identified by degree centrality in the relevant social network. Those who are ranked high on this metrics have more connections to others in the same network. The scientific name of this measure is total degree centrality and it is calculated on the agent by agent matrices.
Input network: test (size: 18, density: 0.107843)
Rank Agent Value Unscaled Context* 1 John 0.118 4.000 0.134 2 Peter 0.059 2.000 -0.670 3 Elias 0.059 2.000 -0.670 4 Mark 0.029 1.000 -1.073 5 Ambrose 0.029 1.000 -1.073 6 Louis 0.029 1.000 -1.073 7 Albert 0.029 1.000 -1.073 * Number of standard deviations from the mean of a random network of the same size and density
Mean: 0.010 Mean in random network: 0.108 Std.dev: 0.039 Std.dev in random network: 0.073 In-degree centrality
The In Degree Centrality of a node is its normalized in-degree. For any node, e.g. an individual or a resource, the in-links are the connections that the node of interest receives from other nodes. For example, imagine an agent by knowledge matrix then the number of in-links a piece of knowledge has is the number of agents that are connected to. The scientific name of this measure is in-degree and it is calculated on the agent by agent matrices.
Input network(s): test
Rank Agent Value Unscaled 1 John 0.235 4.000 2 Elias 0.118 2.000 3 Peter 0.059 1.000 4 Mark 0.059 1.000 5 Albert 0.059 1.000 Out-degree centrality
For any node, e.g. an individual or a resource, the out-links are the connections that the node of interest sends to other nodes. For example, imagine an agent by knowledge matrix then the number of out-links an agent would have is the number of pieces of knowledge it is connected to. The scientific name of this measure is out-degree and it is calculated on the agent by agent matrices. Individuals or organizations who are high in most knowledge have more expertise or are associated with more types of knowledge than are others. If no sub-network connecting agents to knowledge exists, then this measure will not be calculated. The scientific name of this measure is out degree centrality and it is calculated on agent by knowledge matrices. Individuals or organizations who are high in "most resources" have more resources or are associated with more types of resources than are others. If no sub-network connecting agents to resources exists, then this measure will not be calculated. The scientific name of this measure is out degree centrality and it is calculated on agent by resource matrices.
Input network(s): test
Rank Agent Value Unscaled 1 Peter 0.059 1.000 2 Ambrose 0.059 1.000 3 Louis 0.059 1.000 Eigenvector centrality
Calculates the principal eigenvector of the network. A node is central to the extent that its neighbors are central. Leaders of strong cliques are individuals who or organizations who are collected to others that are themselves highly connected to each other. In other words, if you have a clique then the individual most connected to others in the clique and other cliques, is the leader of the clique. Individuals or organizations who are connected to many otherwise isolated individuals or organizations will have a much lower score in this measure then those that are connected to groups that have many connections themselves. The scientific name of this measure is eigenvector centrality and it is calculated on agent by agent matrices.
Input network: test (size: 18, density: 0.107843)
Rank Agent Value Unscaled Context* 1 Bosco 0.667 0.472 0.922 2 Gregory 0.356 0.252 -0.005 3 Boniface 0.338 0.239 -0.059 4 Berthold 0.277 0.196 -0.243 5 John 0.254 0.180 -0.310 6 Amand 0.238 0.168 -0.358 7 Hugh 0.208 0.147 -0.447 8 Elias 0.092 0.065 -0.794 9 Albert 0.091 0.065 -0.795 10 Louis 0.062 0.044 -0.884 * Number of standard deviations from the mean of a random network of the same size and density
Mean: 0.004 Mean in random network: 0.358 Std.dev: 0.333 Std.dev in random network: 0.335 Eigenvector centrality per component
Calculates the principal eigenvector of the network. A node is central to the extent that its neighbors are central. Each component is extracted as a separate network, Eigenvector Centrality is computed on it and scaled according to the component size. The scores are then combined into a single result vector.
Input network(s): test
Rank Agent Value 1 Bosco 0.472 2 Gregory 0.252 3 Boniface 0.239 4 Berthold 0.196 5 John 0.180 6 Amand 0.168 7 Hugh 0.147 8 Elias 0.065 9 Albert 0.065 10 Louis 0.044 Closeness centrality
The average closeness of a node to the other nodes in a network (also called out-closeness). Loosely, Closeness is the inverse of the average distance in the network from the node to all other nodes.
Input network: test (size: 18, density: 0.107843)
Rank Agent Value Context* 1 All nodes have this value -0.000 * Number of standard deviations from the mean of a random network of the same size and density
Mean: -0.000 Mean in random network: 0.284 Std.dev: 0.000 Std.dev in random network: 0.050 In-Closeness centrality
The average closeness of a node from the other nodes in a network. Loosely, Closeness is the inverse of the average distance in the network to the node and from all other nodes.
Input network(s): test
Rank Agent Value 1 Bosco 9570149208162304.000 2 Basil 9570149208162304.000 3 Gregory 5704253440.000 4 Berthold 5419041792.000 5 John 5133828096.000 6 Peter 4848614912.000 7 Victor -0.056 8 Ambrose -0.056 9 Ramuald -0.056 10 Louis -0.056 Betweenness centrality
The Betweenness Centrality of node v in a network is defined as: across all node pairs that have a shortest path containing v, the percentage that pass through v. Individuals or organizations that are potentially influential are positioned to broker connections between groups and to bring to bear the influence of one group on another or serve as a gatekeeper between groups. This agent occurs on many of the shortest paths between other agents. The scientific name of this measure is betweenness centrality and it is calculated on agent by agent matrices.
Input network: test (size: 18, density: 0.107843)
Rank Agent Value Unscaled Context* 1 John 1.#IO 1.#IO 1.#IO 2 Bosco 1.#IO 1.#IO 1.#IO 3 Basil 1.#IO 1.#IO 1.#IO 4 Berthold 1.#IO 1.#IO 1.#IO 5 Elias 0.026 7.000 -1.051 6 Winfrid 0.015 4.000 -1.197 7 Albert 0.011 3.000 -1.246 * Number of standard deviations from the mean of a random network of the same size and density
Mean: 1.#IO Mean in random network: 0.105 Std.dev: -1.#IO Std.dev in random network: 0.075 Hub centrality
A node is hub-central to the extent that its out-links are to nodes that have many in-links. Individuals or organizations that act as hubs are sending information to a wide range of others each of whom has many others reporting to them. Technically, an agent is hub-central if its out-links are to agents that have many other agents sending links to them. The scientific name of this measure is hub centrality and it is calculated on agent by agent matrices.
Input network(s): test
Rank Agent Value 1 Berthold 0.530 2 Boniface 0.530 3 Bosco 0.443 4 Gregory 0.443 5 Amand 0.443 6 Hugh 0.224 7 Louis 0.119 8 John 0.042 9 Elias 0.029 10 Albert -0.022 Authority centrality
A node is authority-central to the extent that its in-links are from nodes that have many out-links. Individuals or organizations that act as authorities are receiving information from a wide range of others each of whom sends information to a large number of others. Technically, an agent is authority-central if its in-links are from agents that have are sending links to many others. The scientific name of this measure is authority centrality and it is calculated on agent by agent matrices.
Input network(s): test
Rank Agent Value 1 Basil 1.128 2 Mark 0.094 3 Elias 0.071 4 Peter 0.064 5 Winfrid 0.064 6 Berthold 0.012 Information centrality
Calculate the Stephenson and Zelen information centrality measure for each node.
Input network(s): test
Rank Agent Value Unscaled 1 Peter 0.333 1.180 2 Ambrose 0.333 1.180 3 Louis 0.333 1.180 Clique membership count
The number of distinct cliques to which each node belongs. Individuals or organizations who are high in number of cliques are those that belong to a large number of distinct cliques. A clique is defined as a group of three or more actors that have many connections to each other and relatively fewer connections to those in other groups. The scientific name of this measure is clique count and it is calculated on the agent by agent matrices.
Input network(s): test
Rank Agent Value 1 Bosco 6.000 2 Basil 4.000 3 Berthold 2.000 4 Mark 2.000 5 John 1.000 6 Gregory 1.000 7 Bonaventure 1.000 8 Ramuald 1.000 9 Winfrid 1.000 10 Hugh 1.000 Simmelian ties
The normalized number of Simmelian ties of each node.
Input network(s): test
Rank Agent Value Unscaled 1 All nodes have this value 0.000 Clustering coefficient
Measures the degree of clustering in a network by averaging the clustering coefficient of each node, which is defined as the density of the node's ego network.
Input network(s): test
Rank Agent Value 1 Boniface 1.000 2 Berthold 0.500 3 Ramuald 0.500 4 Hugh 0.500 5 Bonaventure 0.167 6 Winfrid 0.167 7 Mark 0.150 8 Bosco 0.107 9 Gregory 0.083 10 Basil 0.056
Key Nodes Table
This shows the top scoring nodes side-by-side for selected measures.
Rank Betweenness centrality Closeness centrality Eigenvector centrality Eigenvector centrality per component In-degree centrality In-Closeness centrality Out-degree centrality Total degree centrality 1 John John Bosco Bosco John Bosco Peter John 2 Bosco Bosco Gregory Gregory Elias Basil Ambrose Peter 3 Basil Gregory Boniface Boniface Peter Gregory Louis Elias 4 Berthold Basil Berthold Berthold Mark Berthold John Mark 5 Elias Peter John John Albert John Bosco Ambrose 6 Winfrid Bonaventure Amand Amand Victor Peter Gregory Louis 7 Albert Berthold Hugh Hugh Ambrose Victor Basil Albert 8 Gregory Mark Elias Elias Ramuald Ambrose Bonaventure Victor 9 Peter Victor Albert Albert Louis Ramuald Berthold Ramuald 10 Bonaventure Ambrose Louis Louis Amand Louis Mark Amand