Calculates common social network measures on each selected input network.
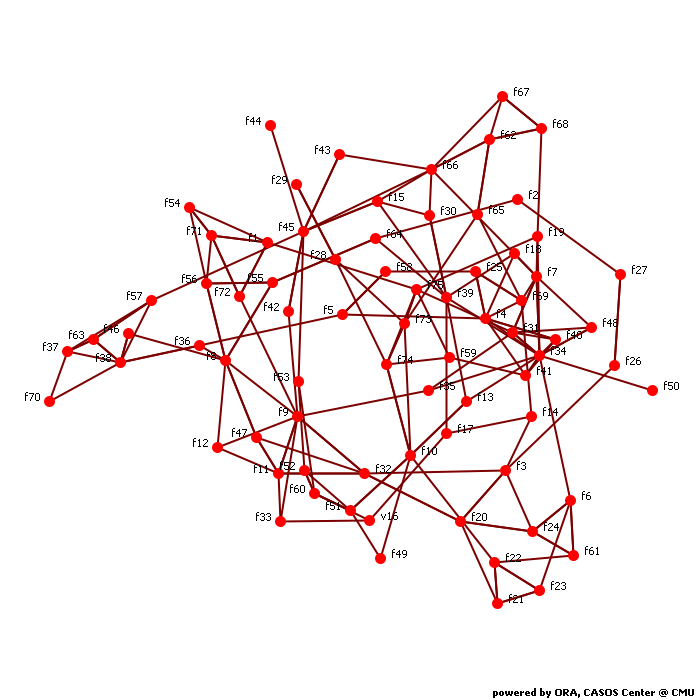
Network test
Network Level Measures
Measure Value Row count 75.000 Column count 75.000 Link count 197.000 Density 0.035 Components of 1 node (isolates) 0 Components of 2 nodes (dyadic isolates) 0 Components of 3 or more nodes 1 Reciprocity 0.368 Characteristic path length 5.475 Clustering coefficient 0.232 Network levels (diameter) 15.000 Network fragmentation 0.000 Krackhardt connectedness 1.000 Krackhardt efficiency 0.974 Krackhardt hierarchy 0.649 Krackhardt upperboundedness 0.882 Degree centralization 0.068 Betweenness centralization 0.127 Closeness centralization 0.029 Eigenvector centralization 0.593 Reciprocal (symmetric)? No (36% of the links are reciprocal)
Node Level Measures
Measure Min Max Avg Stddev Total degree centrality 0.007 0.101 0.035 0.017 Total degree centrality [Unscaled] 1.000 15.000 5.253 2.472 In-degree centrality 0.000 0.162 0.035 0.030 In-degree centrality [Unscaled] 0.000 12.000 2.627 2.238 Out-degree centrality 0.014 0.041 0.035 0.008 Out-degree centrality [Unscaled] 1.000 3.000 2.627 0.606 Eigenvector centrality 0.004 0.683 0.106 0.124 Eigenvector centrality [Unscaled] 0.003 0.483 0.075 0.088 Eigenvector centrality per component 0.003 0.483 0.075 0.088 Closeness centrality 0.015 0.046 0.032 0.008 Closeness centrality [Unscaled] 0.000 0.001 0.000 0.000 In-Closeness centrality 0.013 0.326 0.065 0.070 In-Closeness centrality [Unscaled] 0.000 0.004 0.001 0.001 Betweenness centrality 0.000 0.161 0.035 0.044 Betweenness centrality [Unscaled] 0.000 867.133 191.413 238.083 Hub centrality 0.000 0.475 0.100 0.129 Authority centrality 0.000 1.056 0.067 0.149 Information centrality 0.003 0.018 0.013 0.003 Information centrality [Unscaled] 0.118 0.828 0.617 0.153 Clique membership count 0.000 6.000 1.440 1.192 Simmelian ties 0.000 0.027 0.006 0.012 Simmelian ties [Unscaled] 0.000 2.000 0.480 0.854 Clustering coefficient 0.000 1.000 0.232 0.209
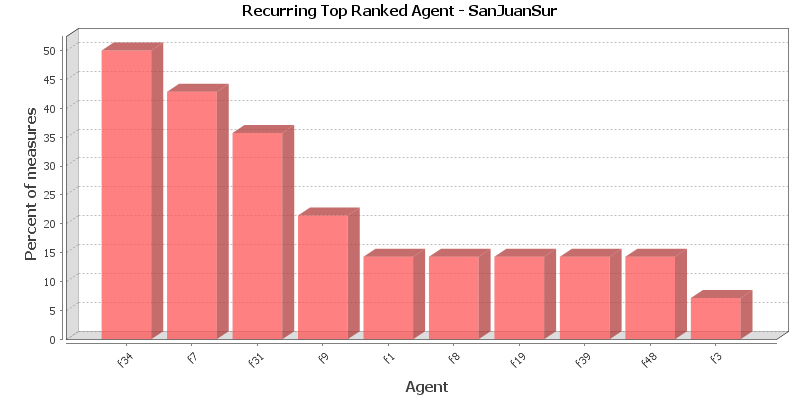
Key Nodes
This chart shows the Agent that is repeatedly top-ranked in the measures listed below. The value shown is the percentage of measures for which the Agent was ranked in the top three.
Total degree centrality
The Total Degree Centrality of a node is the normalized sum of its row and column degrees. Individuals or organizations who are "in the know" are those who are linked to many others and so, by virtue of their position have access to the ideas, thoughts, beliefs of many others. Individuals who are "in the know" are identified by degree centrality in the relevant social network. Those who are ranked high on this metrics have more connections to others in the same network. The scientific name of this measure is total degree centrality and it is calculated on the agent by agent matrices.
Input network: test (size: 75, density: 0.0354955)
Rank Agent Value Unscaled Context* 1 f34 0.101 15.000 3.082 2 f8 0.068 10.000 1.501 3 f9 0.068 10.000 1.501 4 f45 0.068 10.000 1.501 5 f4 0.061 9.000 1.185 6 f7 0.061 9.000 1.185 7 f10 0.061 9.000 1.185 8 f38 0.061 9.000 1.185 9 f11 0.054 8.000 0.869 10 f31 0.054 8.000 0.869 * Number of standard deviations from the mean of a random network of the same size and density
Mean: 0.035 Mean in random network: 0.035 Std.dev: 0.017 Std.dev in random network: 0.021 In-degree centrality
The In Degree Centrality of a node is its normalized in-degree. For any node, e.g. an individual or a resource, the in-links are the connections that the node of interest receives from other nodes. For example, imagine an agent by knowledge matrix then the number of in-links a piece of knowledge has is the number of agents that are connected to. The scientific name of this measure is in-degree and it is calculated on the agent by agent matrices.
Input network(s): test
Rank Agent Value Unscaled 1 f34 0.162 12.000 2 f7 0.095 7.000 3 f8 0.095 7.000 4 f9 0.095 7.000 5 f45 0.095 7.000 6 f4 0.081 6.000 7 f10 0.081 6.000 8 f38 0.081 6.000 9 f11 0.068 5.000 10 f31 0.068 5.000 Out-degree centrality
For any node, e.g. an individual or a resource, the out-links are the connections that the node of interest sends to other nodes. For example, imagine an agent by knowledge matrix then the number of out-links an agent would have is the number of pieces of knowledge it is connected to. The scientific name of this measure is out-degree and it is calculated on the agent by agent matrices. Individuals or organizations who are high in most knowledge have more expertise or are associated with more types of knowledge than are others. If no sub-network connecting agents to knowledge exists, then this measure will not be calculated. The scientific name of this measure is out degree centrality and it is calculated on agent by knowledge matrices. Individuals or organizations who are high in "most resources" have more resources or are associated with more types of resources than are others. If no sub-network connecting agents to resources exists, then this measure will not be calculated. The scientific name of this measure is out degree centrality and it is calculated on agent by resource matrices.
Input network(s): test
Rank Agent Value Unscaled 1 f1 0.041 3.000 2 f3 0.041 3.000 3 f4 0.041 3.000 4 f6 0.041 3.000 5 f8 0.041 3.000 6 f9 0.041 3.000 7 f10 0.041 3.000 8 f11 0.041 3.000 9 f12 0.041 3.000 10 f13 0.041 3.000 Eigenvector centrality
Calculates the principal eigenvector of the network. A node is central to the extent that its neighbors are central. Leaders of strong cliques are individuals who or organizations who are collected to others that are themselves highly connected to each other. In other words, if you have a clique then the individual most connected to others in the clique and other cliques, is the leader of the clique. Individuals or organizations who are connected to many otherwise isolated individuals or organizations will have a much lower score in this measure then those that are connected to groups that have many connections themselves. The scientific name of this measure is eigenvector centrality and it is calculated on agent by agent matrices.
Input network: test (size: 75, density: 0.0354955)
Rank Agent Value Unscaled Context* 1 f34 0.683 0.483 -0.625 2 f7 0.450 0.319 -1.558 3 f31 0.434 0.307 -1.626 4 f4 0.382 0.270 -1.835 5 f40 0.348 0.246 -1.970 6 f48 0.304 0.215 -2.148 7 f41 0.297 0.210 -2.173 8 f39 0.292 0.206 -2.195 9 f19 0.278 0.196 -2.252 10 f35 0.237 0.167 -2.417 * Number of standard deviations from the mean of a random network of the same size and density
Mean: 0.106 Mean in random network: 0.838 Std.dev: 0.124 Std.dev in random network: 0.249 Eigenvector centrality per component
Calculates the principal eigenvector of the network. A node is central to the extent that its neighbors are central. Each component is extracted as a separate network, Eigenvector Centrality is computed on it and scaled according to the component size. The scores are then combined into a single result vector.
Input network(s): test
Rank Agent Value 1 f34 0.483 2 f7 0.319 3 f31 0.307 4 f4 0.270 5 f40 0.246 6 f48 0.215 7 f41 0.210 8 f39 0.206 9 f19 0.196 10 f35 0.167 Closeness centrality
The average closeness of a node to the other nodes in a network (also called out-closeness). Loosely, Closeness is the inverse of the average distance in the network from the node to all other nodes.
Input network: test (size: 75, density: 0.0354955)
Rank Agent Value Unscaled Context* 1 f70 0.046 0.001 -0.044 2 f36 0.046 0.001 -0.050 3 f57 0.045 0.001 -0.073 4 f46 0.045 0.001 -0.075 5 f38 0.045 0.001 -0.081 6 f37 0.045 0.001 -0.106 7 f63 0.045 0.001 -0.106 8 v16 0.040 0.001 -0.309 9 f2 0.037 0.001 -0.404 10 f17 0.036 0.000 -0.447 * Number of standard deviations from the mean of a random network of the same size and density
Mean: 0.032 Mean in random network: 0.047 Std.dev: 0.008 Std.dev in random network: 0.024 In-Closeness centrality
The average closeness of a node from the other nodes in a network. Loosely, Closeness is the inverse of the average distance in the network to the node and from all other nodes.
Input network(s): test
Rank Agent Value Unscaled 1 f34 0.326 0.004 2 f7 0.290 0.004 3 f31 0.280 0.004 4 f48 0.247 0.003 5 f40 0.240 0.003 6 f4 0.216 0.003 7 f41 0.195 0.003 8 f25 0.186 0.003 9 f69 0.171 0.002 10 f9 0.064 0.001 Betweenness centrality
The Betweenness Centrality of node v in a network is defined as: across all node pairs that have a shortest path containing v, the percentage that pass through v. Individuals or organizations that are potentially influential are positioned to broker connections between groups and to bring to bear the influence of one group on another or serve as a gatekeeper between groups. This agent occurs on many of the shortest paths between other agents. The scientific name of this measure is betweenness centrality and it is calculated on agent by agent matrices.
Input network: test (size: 75, density: 0.0354955)
Rank Agent Value Unscaled Context* 1 f39 0.161 867.133 0.852 2 f9 0.157 850.067 0.830 3 f10 0.150 809.250 0.779 4 f45 0.146 786.117 0.750 5 f8 0.138 743.100 0.695 6 f15 0.124 670.483 0.604 7 f32 0.111 602.183 0.518 8 f66 0.107 579.133 0.489 9 f13 0.105 567.583 0.474 10 f42 0.101 547.117 0.448 * Number of standard deviations from the mean of a random network of the same size and density
Mean: 0.035 Mean in random network: 0.035 Std.dev: 0.044 Std.dev in random network: 0.147 Hub centrality
A node is hub-central to the extent that its out-links are to nodes that have many in-links. Individuals or organizations that act as hubs are sending information to a wide range of others each of whom has many others reporting to them. Technically, an agent is hub-central if its out-links are to agents that have many other agents sending links to them. The scientific name of this measure is hub centrality and it is calculated on agent by agent matrices.
Input network(s): test
Rank Agent Value 1 f48 0.475 2 f31 0.455 3 f19 0.422 4 f41 0.409 5 f35 0.391 6 f40 0.364 7 f4 0.362 8 f7 0.344 9 f13 0.332 10 f6 0.297 Authority centrality
A node is authority-central to the extent that its in-links are from nodes that have many out-links. Individuals or organizations that act as authorities are receiving information from a wide range of others each of whom sends information to a large number of others. Technically, an agent is authority-central if its in-links are from agents that have are sending links to many others. The scientific name of this measure is authority centrality and it is calculated on agent by agent matrices.
Input network(s): test
Rank Agent Value 1 f34 1.056 2 f7 0.544 3 f31 0.377 4 f4 0.353 5 f40 0.294 6 f9 0.194 7 f39 0.184 8 f25 0.158 9 f75 0.156 10 f10 0.144 Information centrality
Calculate the Stephenson and Zelen information centrality measure for each node.
Input network(s): test
Rank Agent Value Unscaled 1 f39 0.018 0.828 2 f19 0.018 0.811 3 f12 0.017 0.803 4 v16 0.017 0.803 5 f18 0.017 0.803 6 f53 0.017 0.803 7 f59 0.017 0.803 8 f35 0.017 0.803 9 f30 0.017 0.791 10 f13 0.017 0.791 Clique membership count
The number of distinct cliques to which each node belongs. Individuals or organizations who are high in number of cliques are those that belong to a large number of distinct cliques. A clique is defined as a group of three or more actors that have many connections to each other and relatively fewer connections to those in other groups. The scientific name of this measure is clique count and it is calculated on the agent by agent matrices.
Input network(s): test
Rank Agent Value 1 f34 6.000 2 f9 4.000 3 f11 4.000 4 f66 4.000 5 f74 4.000 6 f15 3.000 7 f31 3.000 8 f32 3.000 9 f71 3.000 10 f73 3.000 Simmelian ties
The normalized number of Simmelian ties of each node.
Input network(s): test
Rank Agent Value Unscaled 1 f1 0.027 2.000 2 f6 0.027 2.000 3 f7 0.027 2.000 4 f8 0.027 2.000 5 f9 0.027 2.000 6 f11 0.027 2.000 7 f21 0.027 2.000 8 f22 0.027 2.000 9 f23 0.027 2.000 10 f24 0.027 2.000 Clustering coefficient
Measures the degree of clustering in a network by averaging the clustering coefficient of each node, which is defined as the density of the node's ego network.
Input network(s): test
Rank Agent Value 1 f48 1.000 2 f49 1.000 3 f67 0.667 4 f12 0.500 5 f37 0.500 6 f43 0.500 7 f52 0.500 8 f54 0.500 9 f63 0.500 10 f70 0.500
Key Nodes Table
This shows the top scoring nodes side-by-side for selected measures.
Rank Betweenness centrality Closeness centrality Eigenvector centrality Eigenvector centrality per component In-degree centrality In-Closeness centrality Out-degree centrality Total degree centrality 1 f39 f70 f34 f34 f34 f34 f1 f34 2 f9 f36 f7 f7 f7 f7 f3 f8 3 f10 f57 f31 f31 f8 f31 f4 f9 4 f45 f46 f4 f4 f9 f48 f6 f45 5 f8 f38 f40 f40 f45 f40 f8 f4 6 f15 f37 f48 f48 f4 f4 f9 f7 7 f32 f63 f41 f41 f10 f41 f10 f10 8 f66 v16 f39 f39 f38 f25 f11 f38 9 f13 f2 f19 f19 f11 f69 f12 f11 10 f42 f17 f35 f35 f31 f9 f13 f31