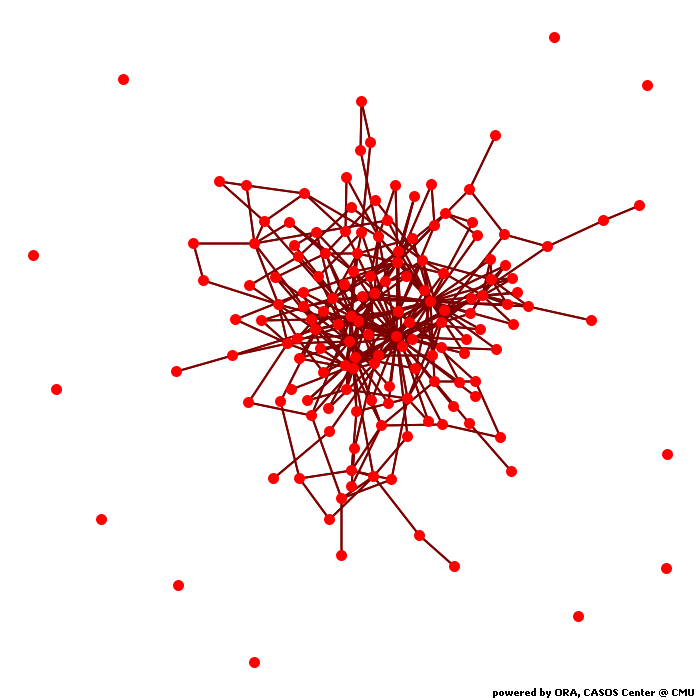
Calculates common social network measures on each selected input network.
Network test
Network Level Measures
Measure Value Row count 153.000 Column count 153.000 Link count 326.000 Density 0.028 Components of 1 node (isolates) 11 Components of 2 nodes (dyadic isolates) 0 Components of 3 or more nodes 1 Reciprocity 1.000 Characteristic path length 3.173 Clustering coefficient 0.113 Network levels (diameter) 8.000 Network fragmentation 0.139 Krackhardt connectedness 0.861 Krackhardt efficiency 0.981 Krackhardt hierarchy 0.000 Krackhardt upperboundedness 1.000 Degree centralization 0.243 Betweenness centralization 0.316 Closeness centralization 0.022 Eigenvector centralization 0.560 Reciprocal (symmetric)? Yes
Node Level Measures
Measure Min Max Avg Stddev Total degree centrality 0.000 0.268 0.028 0.034 Total degree centrality [Unscaled] 0.000 41.000 4.235 5.195 In-degree centrality 0.000 0.268 0.028 0.034 In-degree centrality [Unscaled] 0.000 41.000 4.235 5.195 Out-degree centrality 0.000 0.268 0.028 0.034 Out-degree centrality [Unscaled] 0.000 41.000 4.235 5.195 Eigenvector centrality 0.000 0.626 0.074 0.087 Eigenvector centrality [Unscaled] 0.000 0.443 0.052 0.062 Eigenvector centrality per component 0.000 0.411 0.048 0.057 Closeness centrality 0.007 0.078 0.067 0.017 Closeness centrality [Unscaled] 0.000 0.001 0.000 0.000 In-Closeness centrality 0.007 0.078 0.067 0.017 In-Closeness centrality [Unscaled] 0.000 0.001 0.000 0.000 Betweenness centrality 0.000 0.326 0.012 0.034 Betweenness centrality [Unscaled] 0.000 3745.290 142.196 395.624 Hub centrality 0.000 0.626 0.074 0.087 Authority centrality 0.000 0.626 0.074 0.087 Information centrality 0.000 0.012 0.007 0.003 Information centrality [Unscaled] 0.000 1.853 0.994 0.418 Clique membership count 0.000 27.000 1.144 3.431 Simmelian ties 0.000 0.164 0.009 0.022 Simmelian ties [Unscaled] 0.000 25.000 1.373 3.302 Clustering coefficient 0.000 1.000 0.113 0.198
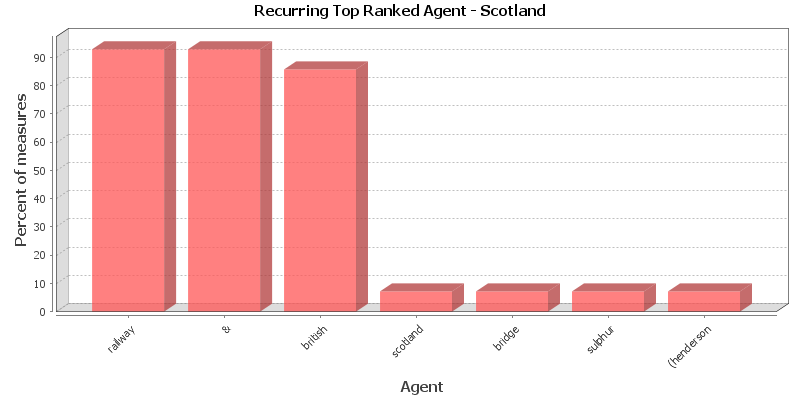
Key Nodes
This chart shows the Agent that is repeatedly top-ranked in the measures listed below. The value shown is the percentage of measures for which the Agent was ranked in the top three.
Total degree centrality
The Total Degree Centrality of a node is the normalized sum of its row and column degrees. Individuals or organizations who are "in the know" are those who are linked to many others and so, by virtue of their position have access to the ideas, thoughts, beliefs of many others. Individuals who are "in the know" are identified by degree centrality in the relevant social network. Those who are ranked high on this metrics have more connections to others in the same network. The scientific name of this measure is total degree centrality and it is calculated on the agent by agent matrices.
Input network: test (size: 153, density: 0.0276717)
Rank Agent Value Unscaled Context* 1 & 0.268 41.000 18.121 2 railway 0.229 35.000 15.164 3 british 0.124 19.000 7.278 4 of 0.118 18.000 6.785 5 scotland 0.105 16.000 5.799 6 north 0.098 15.000 5.306 7 bank 0.098 15.000 5.306 8 iron 0.085 13.000 4.321 9 scottish 0.085 13.000 4.321 10 tea 0.072 11.000 3.335 * Number of standard deviations from the mean of a random network of the same size and density
Mean: 0.028 Mean in random network: 0.028 Std.dev: 0.034 Std.dev in random network: 0.013 In-degree centrality
The In Degree Centrality of a node is its normalized in-degree. For any node, e.g. an individual or a resource, the in-links are the connections that the node of interest receives from other nodes. For example, imagine an agent by knowledge matrix then the number of in-links a piece of knowledge has is the number of agents that are connected to. The scientific name of this measure is in-degree and it is calculated on the agent by agent matrices.
Input network(s): test
Rank Agent Value Unscaled 1 & 0.268 41.000 2 railway 0.229 35.000 3 british 0.124 19.000 4 of 0.118 18.000 5 scotland 0.105 16.000 6 north 0.098 15.000 7 bank 0.098 15.000 8 iron 0.085 13.000 9 scottish 0.085 13.000 10 tea 0.072 11.000 Out-degree centrality
For any node, e.g. an individual or a resource, the out-links are the connections that the node of interest sends to other nodes. For example, imagine an agent by knowledge matrix then the number of out-links an agent would have is the number of pieces of knowledge it is connected to. The scientific name of this measure is out-degree and it is calculated on the agent by agent matrices. Individuals or organizations who are high in most knowledge have more expertise or are associated with more types of knowledge than are others. If no sub-network connecting agents to knowledge exists, then this measure will not be calculated. The scientific name of this measure is out degree centrality and it is calculated on agent by knowledge matrices. Individuals or organizations who are high in "most resources" have more resources or are associated with more types of resources than are others. If no sub-network connecting agents to resources exists, then this measure will not be calculated. The scientific name of this measure is out degree centrality and it is calculated on agent by resource matrices.
Input network(s): test
Rank Agent Value Unscaled 1 & 0.268 41.000 2 railway 0.229 35.000 3 british 0.124 19.000 4 of 0.118 18.000 5 scotland 0.105 16.000 6 north 0.098 15.000 7 bank 0.098 15.000 8 iron 0.085 13.000 9 scottish 0.085 13.000 10 tea 0.072 11.000 Eigenvector centrality
Calculates the principal eigenvector of the network. A node is central to the extent that its neighbors are central. Leaders of strong cliques are individuals who or organizations who are collected to others that are themselves highly connected to each other. In other words, if you have a clique then the individual most connected to others in the clique and other cliques, is the leader of the clique. Individuals or organizations who are connected to many otherwise isolated individuals or organizations will have a much lower score in this measure then those that are connected to groups that have many connections themselves. The scientific name of this measure is eigenvector centrality and it is calculated on agent by agent matrices.
Input network: test (size: 153, density: 0.0276717)
Rank Agent Value Unscaled Context* 1 & 0.626 0.443 -2.946 2 railway 0.530 0.374 -3.449 3 british 0.379 0.268 -4.233 4 bank 0.258 0.183 -4.858 5 of 0.252 0.178 -4.890 6 line 0.251 0.177 -4.897 7 iron 0.247 0.174 -4.919 8 power 0.233 0.165 -4.991 9 scottish 0.230 0.163 -5.005 10 north 0.227 0.161 -5.019 * Number of standard deviations from the mean of a random network of the same size and density
Mean: 0.074 Mean in random network: 1.194 Std.dev: 0.087 Std.dev in random network: 0.192 Eigenvector centrality per component
Calculates the principal eigenvector of the network. A node is central to the extent that its neighbors are central. Each component is extracted as a separate network, Eigenvector Centrality is computed on it and scaled according to the component size. The scores are then combined into a single result vector.
Input network(s): test
Rank Agent Value 1 & 0.411 2 railway 0.348 3 british 0.249 4 bank 0.170 5 of 0.166 6 line 0.165 7 iron 0.162 8 power 0.153 9 scottish 0.151 10 north 0.149 Closeness centrality
The average closeness of a node to the other nodes in a network (also called out-closeness). Loosely, Closeness is the inverse of the average distance in the network from the node to all other nodes.
Input network: test (size: 153, density: 0.0276717)
Rank Agent Value Unscaled Context* 1 & 0.078 0.001 -46.867 2 railway 0.077 0.001 -47.450 3 british 0.076 0.000 -48.659 4 iron 0.076 0.000 -48.938 5 bank 0.075 0.000 -49.076 6 scotland 0.075 0.000 -49.283 7 power 0.075 0.000 -49.352 8 of 0.075 0.000 -49.386 9 line 0.075 0.000 -49.625 10 north 0.075 0.000 -49.659 * Number of standard deviations from the mean of a random network of the same size and density
Mean: 0.067 Mean in random network: 0.128 Std.dev: 0.017 Std.dev in random network: 0.001 In-Closeness centrality
The average closeness of a node from the other nodes in a network. Loosely, Closeness is the inverse of the average distance in the network to the node and from all other nodes.
Input network(s): test
Rank Agent Value Unscaled 1 & 0.078 0.001 2 railway 0.077 0.001 3 british 0.076 0.000 4 iron 0.076 0.000 5 bank 0.075 0.000 6 scotland 0.075 0.000 7 power 0.075 0.000 8 of 0.075 0.000 9 line 0.075 0.000 10 north 0.075 0.000 Betweenness centrality
The Betweenness Centrality of node v in a network is defined as: across all node pairs that have a shortest path containing v, the percentage that pass through v. Individuals or organizations that are potentially influential are positioned to broker connections between groups and to bring to bear the influence of one group on another or serve as a gatekeeper between groups. This agent occurs on many of the shortest paths between other agents. The scientific name of this measure is betweenness centrality and it is calculated on agent by agent matrices.
Input network: test (size: 153, density: 0.0276717)
Rank Agent Value Unscaled Context* 1 & 0.326 3745.290 4.442 2 railway 0.225 2586.068 2.990 3 scotland 0.084 967.781 0.963 4 british 0.083 954.770 0.947 5 iron 0.070 800.996 0.754 6 bank 0.061 698.735 0.626 7 north 0.056 647.448 0.562 8 of 0.051 583.331 0.482 9 glasgow 0.047 537.534 0.424 10 nobel's 0.046 525.675 0.410 * Number of standard deviations from the mean of a random network of the same size and density
Mean: 0.012 Mean in random network: 0.017 Std.dev: 0.034 Std.dev in random network: 0.070 Hub centrality
A node is hub-central to the extent that its out-links are to nodes that have many in-links. Individuals or organizations that act as hubs are sending information to a wide range of others each of whom has many others reporting to them. Technically, an agent is hub-central if its out-links are to agents that have many other agents sending links to them. The scientific name of this measure is hub centrality and it is calculated on agent by agent matrices.
Input network(s): test
Rank Agent Value 1 & 0.626 2 railway 0.530 3 british 0.379 4 bank 0.258 5 of 0.252 6 line 0.251 7 iron 0.247 8 power 0.233 9 scottish 0.230 10 north 0.227 Authority centrality
A node is authority-central to the extent that its in-links are from nodes that have many out-links. Individuals or organizations that act as authorities are receiving information from a wide range of others each of whom sends information to a large number of others. Technically, an agent is authority-central if its in-links are from agents that have are sending links to many others. The scientific name of this measure is authority centrality and it is calculated on agent by agent matrices.
Input network(s): test
Rank Agent Value 1 & 0.626 2 railway 0.530 3 british 0.379 4 bank 0.258 5 of 0.252 6 line 0.251 7 iron 0.247 8 power 0.233 9 scottish 0.230 10 north 0.227 Information centrality
Calculate the Stephenson and Zelen information centrality measure for each node.
Input network(s): test
Rank Agent Value Unscaled 1 & 0.012 1.853 2 railway 0.012 1.823 3 british 0.011 1.737 4 of 0.011 1.727 5 scotland 0.011 1.708 6 bank 0.011 1.689 7 north 0.011 1.686 8 scottish 0.011 1.657 9 iron 0.011 1.651 10 line 0.011 1.609 Clique membership count
The number of distinct cliques to which each node belongs. Individuals or organizations who are high in number of cliques are those that belong to a large number of distinct cliques. A clique is defined as a group of three or more actors that have many connections to each other and relatively fewer connections to those in other groups. The scientific name of this measure is clique count and it is calculated on the agent by agent matrices.
Input network(s): test
Rank Agent Value 1 & 27.000 2 railway 24.000 3 british 14.000 4 scottish 10.000 5 line 8.000 6 bank 8.000 7 iron 7.000 8 north 6.000 9 of 4.000 10 scotland 4.000 Simmelian ties
The normalized number of Simmelian ties of each node.
Input network(s): test
Rank Agent Value Unscaled 1 & 0.164 25.000 2 railway 0.132 20.000 3 british 0.086 13.000 4 scottish 0.066 10.000 5 bank 0.059 9.000 6 north 0.053 8.000 7 iron 0.053 8.000 8 line 0.053 8.000 9 power 0.039 6.000 10 of 0.033 5.000 Clustering coefficient
Measures the degree of clustering in a network by averaging the clustering coefficient of each node, which is defined as the density of the node's ego network.
Input network(s): test
Rank Agent Value 1 bridge 1.000 2 sulphur 1.000 3 (henderson 1.000 4 motors 1.000 5 refining 0.667 6 engineering 0.667 7 david 0.500 8 allan 0.400 9 younger 0.333 10 dewar 0.333
Key Nodes Table
This shows the top scoring nodes side-by-side for selected measures.
Rank Betweenness centrality Closeness centrality Eigenvector centrality Eigenvector centrality per component In-degree centrality In-Closeness centrality Out-degree centrality Total degree centrality 1 & & & & & & & & 2 railway railway railway railway railway railway railway railway 3 scotland british british british british british british british 4 british iron bank bank of iron of of 5 iron bank of of scotland bank scotland scotland 6 bank scotland line line north scotland north north 7 north power iron iron bank power bank bank 8 of of power power iron of iron iron 9 glasgow line scottish scottish scottish line scottish scottish 10 nobel's north north north tea north tea tea