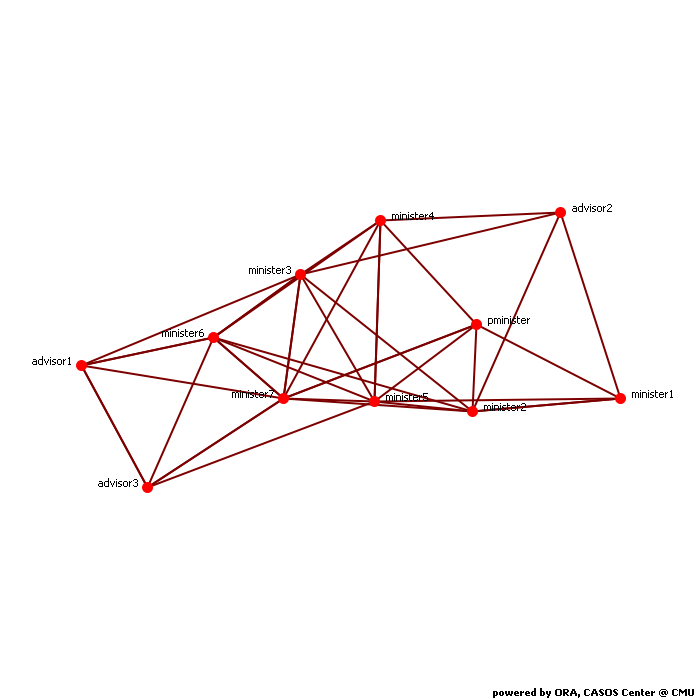
Calculates common social network measures on each selected input network.
Network test
Network Level Measures
Measure Value Row count 11.000 Column count 11.000 Link count 41.000 Density 0.373 Components of 1 node (isolates) 0 Components of 2 nodes (dyadic isolates) 0 Components of 3 or more nodes 1 Reciprocity 0.281 Characteristic path length 1.679 Clustering coefficient 0.440 Network levels (diameter) 4.000 Network fragmentation 0.000 Krackhardt connectedness 1.000 Krackhardt efficiency 0.511 Krackhardt hierarchy 0.473 Krackhardt upperboundedness 1.000 Degree centralization 0.278 Betweenness centralization 0.111 Closeness centralization 0.627 Eigenvector centralization 0.172 Reciprocal (symmetric)? No (28% of the links are reciprocal)
Node Level Measures
Measure Min Max Avg Stddev Total degree centrality 0.200 0.600 0.373 0.114 Total degree centrality [Unscaled] 4.000 12.000 7.455 2.271 In-degree centrality 0.000 0.800 0.373 0.238 In-degree centrality [Unscaled] 0.000 8.000 3.727 2.378 Out-degree centrality 0.100 0.600 0.373 0.135 Out-degree centrality [Unscaled] 1.000 6.000 3.727 1.355 Eigenvector centrality 0.269 0.553 0.413 0.107 Eigenvector centrality [Unscaled] 0.190 0.391 0.292 0.076 Eigenvector centrality per component 0.190 0.391 0.292 0.076 Closeness centrality 0.200 0.556 0.286 0.109 Closeness centrality [Unscaled] 0.020 0.056 0.029 0.011 In-Closeness centrality 0.091 0.833 0.478 0.259 In-Closeness centrality [Unscaled] 0.009 0.083 0.048 0.026 Betweenness centrality 0.000 0.159 0.058 0.058 Betweenness centrality [Unscaled] 0.000 14.267 5.182 5.247 Hub centrality 0.149 0.656 0.391 0.169 Authority centrality 0.000 0.714 0.347 0.248 Information centrality 0.047 0.115 0.091 0.019 Information centrality [Unscaled] 0.966 2.341 1.857 0.383 Clique membership count 2.000 7.000 3.909 1.676 Simmelian ties 0.000 0.200 0.055 0.089 Simmelian ties [Unscaled] 0.000 2.000 0.545 0.891 Clustering coefficient 0.333 0.750 0.440 0.118
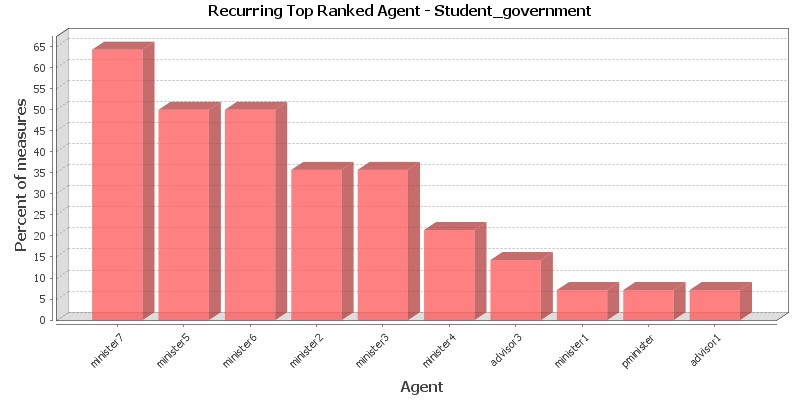
Key Nodes
This chart shows the Agent that is repeatedly top-ranked in the measures listed below. The value shown is the percentage of measures for which the Agent was ranked in the top three.
Total degree centrality
The Total Degree Centrality of a node is the normalized sum of its row and column degrees. Individuals or organizations who are "in the know" are those who are linked to many others and so, by virtue of their position have access to the ideas, thoughts, beliefs of many others. Individuals who are "in the know" are identified by degree centrality in the relevant social network. Those who are ranked high on this metrics have more connections to others in the same network. The scientific name of this measure is total degree centrality and it is calculated on the agent by agent matrices.
Input network: test (size: 11, density: 0.372727)
Rank Agent Value Unscaled Context* 1 minister7 0.600 12.000 1.559 2 minister6 0.500 10.000 0.873 3 minister3 0.450 9.000 0.530 4 minister5 0.450 9.000 0.530 5 minister2 0.400 8.000 0.187 6 minister4 0.350 7.000 -0.156 7 pminister 0.300 6.000 -0.499 8 advisor1 0.300 6.000 -0.499 9 advisor3 0.300 6.000 -0.499 10 minister1 0.250 5.000 -0.842 * Number of standard deviations from the mean of a random network of the same size and density
Mean: 0.373 Mean in random network: 0.373 Std.dev: 0.114 Std.dev in random network: 0.146 In-degree centrality
The In Degree Centrality of a node is its normalized in-degree. For any node, e.g. an individual or a resource, the in-links are the connections that the node of interest receives from other nodes. For example, imagine an agent by knowledge matrix then the number of in-links a piece of knowledge has is the number of agents that are connected to. The scientific name of this measure is in-degree and it is calculated on the agent by agent matrices.
Input network(s): test
Rank Agent Value Unscaled 1 minister7 0.800 8.000 2 minister3 0.700 7.000 3 minister6 0.600 6.000 4 pminister 0.500 5.000 5 minister5 0.400 4.000 6 advisor3 0.300 3.000 7 minister1 0.200 2.000 8 minister2 0.200 2.000 9 minister4 0.200 2.000 10 advisor1 0.200 2.000 Out-degree centrality
For any node, e.g. an individual or a resource, the out-links are the connections that the node of interest sends to other nodes. For example, imagine an agent by knowledge matrix then the number of out-links an agent would have is the number of pieces of knowledge it is connected to. The scientific name of this measure is out-degree and it is calculated on the agent by agent matrices. Individuals or organizations who are high in most knowledge have more expertise or are associated with more types of knowledge than are others. If no sub-network connecting agents to knowledge exists, then this measure will not be calculated. The scientific name of this measure is out degree centrality and it is calculated on agent by knowledge matrices. Individuals or organizations who are high in "most resources" have more resources or are associated with more types of resources than are others. If no sub-network connecting agents to resources exists, then this measure will not be calculated. The scientific name of this measure is out degree centrality and it is calculated on agent by resource matrices.
Input network(s): test
Rank Agent Value Unscaled 1 minister2 0.600 6.000 2 minister4 0.500 5.000 3 minister5 0.500 5.000 4 minister6 0.400 4.000 5 minister7 0.400 4.000 6 advisor1 0.400 4.000 7 advisor2 0.400 4.000 8 minister1 0.300 3.000 9 advisor3 0.300 3.000 10 minister3 0.200 2.000 Eigenvector centrality
Calculates the principal eigenvector of the network. A node is central to the extent that its neighbors are central. Leaders of strong cliques are individuals who or organizations who are collected to others that are themselves highly connected to each other. In other words, if you have a clique then the individual most connected to others in the clique and other cliques, is the leader of the clique. Individuals or organizations who are connected to many otherwise isolated individuals or organizations will have a much lower score in this measure then those that are connected to groups that have many connections themselves. The scientific name of this measure is eigenvector centrality and it is calculated on agent by agent matrices.
Input network: test (size: 11, density: 0.372727)
Rank Agent Value Unscaled Context* 1 minister7 0.553 0.391 -0.100 2 minister5 0.549 0.388 -0.115 3 minister6 0.502 0.355 -0.292 4 minister3 0.498 0.352 -0.310 5 minister2 0.484 0.342 -0.363 6 minister4 0.440 0.311 -0.526 7 pminister 0.369 0.261 -0.796 8 advisor3 0.306 0.216 -1.033 9 advisor1 0.299 0.211 -1.060 10 advisor2 0.271 0.192 -1.163 * Number of standard deviations from the mean of a random network of the same size and density
Mean: 0.413 Mean in random network: 0.580 Std.dev: 0.107 Std.dev in random network: 0.265 Eigenvector centrality per component
Calculates the principal eigenvector of the network. A node is central to the extent that its neighbors are central. Each component is extracted as a separate network, Eigenvector Centrality is computed on it and scaled according to the component size. The scores are then combined into a single result vector.
Input network(s): test
Rank Agent Value 1 minister7 0.391 2 minister5 0.388 3 minister6 0.355 4 minister3 0.352 5 minister2 0.342 6 minister4 0.311 7 pminister 0.261 8 advisor3 0.216 9 advisor1 0.211 10 advisor2 0.192 Closeness centrality
The average closeness of a node to the other nodes in a network (also called out-closeness). Loosely, Closeness is the inverse of the average distance in the network from the node to all other nodes.
Input network: test (size: 11, density: 0.372727)
Rank Agent Value Unscaled Context* 1 advisor2 0.556 0.056 -0.630 2 minister2 0.435 0.043 -1.874 3 minister1 0.357 0.036 -2.673 4 minister4 0.238 0.024 -3.899 5 minister5 0.238 0.024 -3.899 6 minister6 0.227 0.023 -4.010 7 minister7 0.227 0.023 -4.010 8 advisor1 0.227 0.023 -4.010 9 advisor3 0.227 0.023 -4.010 10 minister3 0.208 0.021 -4.205 * Number of standard deviations from the mean of a random network of the same size and density
Mean: 0.286 Mean in random network: 0.617 Std.dev: 0.109 Std.dev in random network: 0.097 In-Closeness centrality
The average closeness of a node from the other nodes in a network. Loosely, Closeness is the inverse of the average distance in the network to the node and from all other nodes.
Input network(s): test
Rank Agent Value Unscaled 1 minister7 0.833 0.083 2 minister3 0.769 0.077 3 minister6 0.714 0.071 4 pminister 0.667 0.067 5 minister5 0.556 0.056 6 advisor3 0.526 0.053 7 advisor1 0.476 0.048 8 minister4 0.400 0.040 9 minister1 0.111 0.011 10 minister2 0.111 0.011 Betweenness centrality
The Betweenness Centrality of node v in a network is defined as: across all node pairs that have a shortest path containing v, the percentage that pass through v. Individuals or organizations that are potentially influential are positioned to broker connections between groups and to bring to bear the influence of one group on another or serve as a gatekeeper between groups. This agent occurs on many of the shortest paths between other agents. The scientific name of this measure is betweenness centrality and it is calculated on agent by agent matrices.
Input network: test (size: 11, density: 0.372727)
Rank Agent Value Unscaled Context* 1 minister7 0.159 14.267 1.294 2 minister5 0.127 11.400 0.727 3 advisor3 0.122 11.000 0.648 4 minister6 0.121 10.900 0.628 5 minister2 0.047 4.233 -0.692 6 minister4 0.022 2.000 -1.134 7 minister3 0.015 1.333 -1.266 8 minister1 0.007 0.667 -1.398 9 advisor1 0.007 0.667 -1.398 10 pminister 0.006 0.533 -1.424 * Number of standard deviations from the mean of a random network of the same size and density
Mean: 0.058 Mean in random network: 0.086 Std.dev: 0.058 Std.dev in random network: 0.056 Hub centrality
A node is hub-central to the extent that its out-links are to nodes that have many in-links. Individuals or organizations that act as hubs are sending information to a wide range of others each of whom has many others reporting to them. Technically, an agent is hub-central if its out-links are to agents that have many other agents sending links to them. The scientific name of this measure is hub centrality and it is calculated on agent by agent matrices.
Input network(s): test
Rank Agent Value 1 minister2 0.656 2 minister4 0.617 3 minister5 0.577 4 advisor1 0.490 5 minister7 0.450 6 minister6 0.383 7 minister3 0.283 8 advisor3 0.252 9 advisor2 0.244 10 minister1 0.204 Authority centrality
A node is authority-central to the extent that its in-links are from nodes that have many out-links. Individuals or organizations that act as authorities are receiving information from a wide range of others each of whom sends information to a large number of others. Technically, an agent is authority-central if its in-links are from agents that have are sending links to many others. The scientific name of this measure is authority centrality and it is calculated on agent by agent matrices.
Input network(s): test
Rank Agent Value 1 minister3 0.714 2 minister7 0.712 3 minister6 0.642 4 pminister 0.523 5 minister5 0.361 6 advisor3 0.276 7 minister1 0.188 8 minister4 0.172 9 advisor1 0.133 10 minister2 0.094 Information centrality
Calculate the Stephenson and Zelen information centrality measure for each node.
Input network(s): test
Rank Agent Value Unscaled 1 minister2 0.115 2.341 2 minister5 0.111 2.270 3 minister4 0.108 2.203 4 minister7 0.100 2.036 5 advisor2 0.097 1.982 6 minister6 0.095 1.934 7 advisor1 0.092 1.877 8 minister1 0.084 1.714 9 advisor3 0.082 1.681 10 minister3 0.070 1.422 Clique membership count
The number of distinct cliques to which each node belongs. Individuals or organizations who are high in number of cliques are those that belong to a large number of distinct cliques. A clique is defined as a group of three or more actors that have many connections to each other and relatively fewer connections to those in other groups. The scientific name of this measure is clique count and it is calculated on the agent by agent matrices.
Input network(s): test
Rank Agent Value 1 minister7 7.000 2 minister5 6.000 3 minister2 5.000 4 minister3 5.000 5 minister6 5.000 6 pminister 3.000 7 minister4 3.000 8 advisor2 3.000 9 minister1 2.000 10 advisor1 2.000 Simmelian ties
The normalized number of Simmelian ties of each node.
Input network(s): test
Rank Agent Value Unscaled 1 minister3 0.200 2.000 2 minister6 0.200 2.000 3 minister7 0.200 2.000 Clustering coefficient
Measures the degree of clustering in a network by averaging the clustering coefficient of each node, which is defined as the density of the node's ego network.
Input network(s): test
Rank Agent Value 1 advisor1 0.750 2 advisor3 0.583 3 pminister 0.450 4 minister4 0.433 5 minister6 0.429 6 minister5 0.393 7 minister2 0.381 8 minister3 0.381 9 minister7 0.375 10 minister1 0.333
Key Nodes Table
This shows the top scoring nodes side-by-side for selected measures.
Rank Betweenness centrality Closeness centrality Eigenvector centrality Eigenvector centrality per component In-degree centrality In-Closeness centrality Out-degree centrality Total degree centrality 1 minister7 advisor2 minister7 minister7 minister7 minister7 minister2 minister7 2 minister5 minister2 minister5 minister5 minister3 minister3 minister4 minister6 3 advisor3 minister1 minister6 minister6 minister6 minister6 minister5 minister3 4 minister6 minister4 minister3 minister3 pminister pminister minister6 minister5 5 minister2 minister5 minister2 minister2 minister5 minister5 minister7 minister2 6 minister4 minister6 minister4 minister4 advisor3 advisor3 advisor1 minister4 7 minister3 minister7 pminister pminister minister1 advisor1 advisor2 pminister 8 minister1 advisor1 advisor3 advisor3 minister2 minister4 minister1 advisor1 9 advisor1 advisor3 advisor1 advisor1 minister4 minister1 advisor3 advisor3 10 pminister minister3 advisor2 advisor2 advisor1 minister2 minister3 minister1