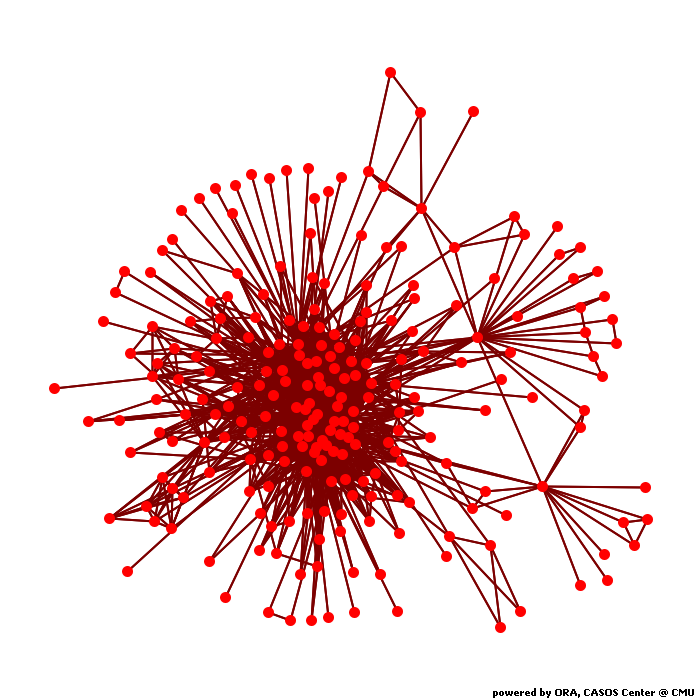
Calculates common social network measures on each selected input network.
Network test
Network Level Measures
Measure Value Row count 232.000 Column count 232.000 Link count 1640.000 Density 0.061 Components of 1 node (isolates) 0 Components of 2 nodes (dyadic isolates) 0 Components of 3 or more nodes 1 Reciprocity 1.000 Characteristic path length 0.070 Clustering coefficient 0.506 Network levels (diameter) 0.583 Network fragmentation 0.000 Krackhardt connectedness 1.000 Krackhardt efficiency 0.947 Krackhardt hierarchy 0.000 Krackhardt upperboundedness 1.000 Degree centralization 0.089 Betweenness centralization 0.445 Closeness centralization 0.018 Eigenvector centralization 0.426 Reciprocal (symmetric)? Yes
Node Level Measures
Measure Min Max Avg Stddev Total degree centrality 0.000 0.099 0.011 0.019 Total degree centrality [Unscaled] 0.001 9.373 1.020 1.792 In-degree centrality 0.000 0.099 0.011 0.019 In-degree centrality [Unscaled] 0.001 9.373 1.020 1.792 Out-degree centrality 0.000 0.099 0.011 0.019 Out-degree centrality [Unscaled] 0.001 9.373 1.020 1.792 Eigenvector centrality 0.000 0.469 0.047 0.080 Eigenvector centrality [Unscaled] 0.000 0.332 0.034 0.056 Eigenvector centrality per component 0.000 0.332 0.034 0.056 Closeness centrality 0.003 0.025 0.016 0.004 Closeness centrality [Unscaled] 0.011 0.108 0.070 0.019 In-Closeness centrality 0.003 0.025 0.016 0.004 In-Closeness centrality [Unscaled] 0.011 0.108 0.070 0.019 Betweenness centrality 0.000 0.458 0.015 0.044 Betweenness centrality [Unscaled] 0.000 12161.588 387.463 1163.734 Hub centrality 0.000 0.471 0.047 0.080 Authority centrality 0.000 0.457 0.047 0.080 Information centrality 0.000 0.006 0.004 0.001 Information centrality [Unscaled] 0.001 0.036 0.027 0.009 Clique membership count 0.000 238.000 17.293 42.098 Simmelian ties 0.000 0.442 0.060 0.084 Simmelian ties [Unscaled] 0.000 102.000 13.750 19.373 Clustering coefficient 0.000 1.000 0.506 0.265
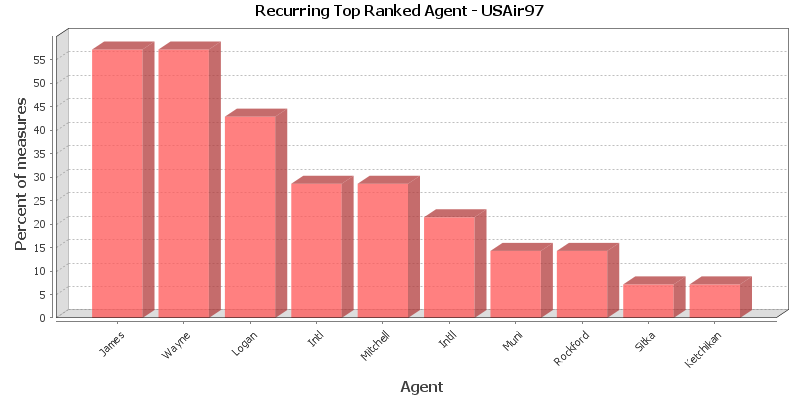
Key Nodes
This chart shows the Agent that is repeatedly top-ranked in the measures listed below. The value shown is the percentage of measures for which the Agent was ranked in the top three.
Total degree centrality
The Total Degree Centrality of a node is the normalized sum of its row and column degrees. Individuals or organizations who are "in the know" are those who are linked to many others and so, by virtue of their position have access to the ideas, thoughts, beliefs of many others. Individuals who are "in the know" are identified by degree centrality in the relevant social network. Those who are ranked high on this metrics have more connections to others in the same network. The scientific name of this measure is total degree centrality and it is calculated on the agent by agent matrices.
Input network: test (size: 232, density: 0.0606778)
Rank Agent Value Unscaled Context* 1 Wayne 0.099 9.373 2.446 2 Logan 0.092 8.694 1.989 3 James 0.073 6.957 0.818 4 Mitchell 0.072 6.807 0.717 5 Erie 0.071 6.678 0.630 6 Rockford 0.068 6.457 0.481 7 Intl 0.067 6.343 0.404 8 Hole 0.066 6.285 0.365 9 Roberts 0.063 5.924 0.122 10 County 0.062 5.881 0.093 * Number of standard deviations from the mean of a random network of the same size and density
Mean: 0.011 Mean in random network: 0.061 Std.dev: 0.019 Std.dev in random network: 0.016 In-degree centrality
The In Degree Centrality of a node is its normalized in-degree. For any node, e.g. an individual or a resource, the in-links are the connections that the node of interest receives from other nodes. For example, imagine an agent by knowledge matrix then the number of in-links a piece of knowledge has is the number of agents that are connected to. The scientific name of this measure is in-degree and it is calculated on the agent by agent matrices.
Input network(s): test
Rank Agent Value Unscaled 1 Wayne 0.099 9.373 2 Logan 0.092 8.694 3 James 0.073 6.957 4 Mitchell 0.072 6.807 5 Erie 0.071 6.678 6 Rockford 0.068 6.457 7 Intl 0.067 6.343 8 Hole 0.066 6.285 9 Roberts 0.063 5.924 10 County 0.062 5.881 Out-degree centrality
For any node, e.g. an individual or a resource, the out-links are the connections that the node of interest sends to other nodes. For example, imagine an agent by knowledge matrix then the number of out-links an agent would have is the number of pieces of knowledge it is connected to. The scientific name of this measure is out-degree and it is calculated on the agent by agent matrices. Individuals or organizations who are high in most knowledge have more expertise or are associated with more types of knowledge than are others. If no sub-network connecting agents to knowledge exists, then this measure will not be calculated. The scientific name of this measure is out degree centrality and it is calculated on agent by knowledge matrices. Individuals or organizations who are high in "most resources" have more resources or are associated with more types of resources than are others. If no sub-network connecting agents to resources exists, then this measure will not be calculated. The scientific name of this measure is out degree centrality and it is calculated on agent by resource matrices.
Input network(s): test
Rank Agent Value Unscaled 1 Wayne 0.099 9.373 2 Logan 0.092 8.694 3 James 0.073 6.957 4 Mitchell 0.072 6.807 5 Erie 0.071 6.678 6 Rockford 0.068 6.457 7 Intl 0.067 6.343 8 Hole 0.066 6.285 9 Roberts 0.063 5.924 10 County 0.062 5.881 Eigenvector centrality
Calculates the principal eigenvector of the network. A node is central to the extent that its neighbors are central. Leaders of strong cliques are individuals who or organizations who are collected to others that are themselves highly connected to each other. In other words, if you have a clique then the individual most connected to others in the clique and other cliques, is the leader of the clique. Individuals or organizations who are connected to many otherwise isolated individuals or organizations will have a much lower score in this measure then those that are connected to groups that have many connections themselves. The scientific name of this measure is eigenvector centrality and it is calculated on agent by agent matrices.
Input network: test (size: 232, density: 0.0606778)
Rank Agent Value Unscaled Context* 1 Wayne 0.469 0.332 -0.711 2 James 0.319 0.226 -1.719 3 Mitchell 0.311 0.220 -1.773 4 Logan 0.286 0.202 -1.946 5 County 0.270 0.191 -2.050 6 Hole 0.256 0.181 -2.143 7 Waterloo 0.256 0.181 -2.146 8 Perce 0.255 0.181 -2.149 9 Klamath 0.255 0.180 -2.154 10 Erie 0.251 0.178 -2.177 * Number of standard deviations from the mean of a random network of the same size and density
Mean: 0.047 Mean in random network: 0.575 Std.dev: 0.080 Std.dev in random network: 0.149 Eigenvector centrality per component
Calculates the principal eigenvector of the network. A node is central to the extent that its neighbors are central. Each component is extracted as a separate network, Eigenvector Centrality is computed on it and scaled according to the component size. The scores are then combined into a single result vector.
Input network(s): test
Rank Agent Value 1 Wayne 0.332 2 James 0.226 3 Mitchell 0.220 4 Logan 0.202 5 County 0.191 6 Hole 0.181 7 Waterloo 0.181 8 Perce 0.181 9 Klamath 0.180 10 Erie 0.178 Closeness centrality
The average closeness of a node to the other nodes in a network (also called out-closeness). Loosely, Closeness is the inverse of the average distance in the network from the node to all other nodes.
Input network: test (size: 232, density: 0.0606778)
Rank Agent Value Unscaled Context* 1 Intll 0.025 0.108 -14.914 2 Muni 0.025 0.107 -14.920 3 Regional 0.024 0.105 -14.940 4 Intl 0.024 0.105 -14.943 5 Grand 0.024 0.104 -14.949 6 Nome 0.024 0.102 -14.967 7 Mitchell 0.024 0.102 -14.969 8 Akron-Canton 0.023 0.102 -14.974 9 Arcata 0.023 0.101 -14.978 10 Mary's 0.023 0.100 -14.985 * Number of standard deviations from the mean of a random network of the same size and density
Mean: 0.016 Mean in random network: 0.388 Std.dev: 0.004 Std.dev in random network: 0.024 In-Closeness centrality
The average closeness of a node from the other nodes in a network. Loosely, Closeness is the inverse of the average distance in the network to the node and from all other nodes.
Input network(s): test
Rank Agent Value Unscaled 1 Intl 0.025 0.108 2 Intll 0.025 0.108 3 Grand 0.024 0.106 4 Nome 0.024 0.105 5 Regional 0.024 0.104 6 Mary's 0.024 0.103 7 Mitchell 0.024 0.102 8 R 0.023 0.102 9 Akron-Canton 0.023 0.102 10 Arcata 0.023 0.101 Betweenness centrality
The Betweenness Centrality of node v in a network is defined as: across all node pairs that have a shortest path containing v, the percentage that pass through v. Individuals or organizations that are potentially influential are positioned to broker connections between groups and to bring to bear the influence of one group on another or serve as a gatekeeper between groups. This agent occurs on many of the shortest paths between other agents. The scientific name of this measure is betweenness centrality and it is calculated on agent by agent matrices.
Input network: test (size: 232, density: 0.0606778)
Rank Agent Value Unscaled Context* 1 Intl 0.458 12161.588 3.625 2 Intll 0.253 6713.488 1.975 3 Muni 0.207 5490.375 1.605 4 Regional 0.185 4915.791 1.431 5 Grand 0.165 4381.571 1.269 6 Memorial 0.128 3392.250 0.969 7 Mitchell 0.104 2753.250 0.776 8 Field 0.094 2505.259 0.701 9 As 0.093 2483.417 0.694 10 Logan 0.092 2441.017 0.681 * Number of standard deviations from the mean of a random network of the same size and density
Mean: 0.015 Mean in random network: 0.007 Std.dev: 0.044 Std.dev in random network: 0.124 Hub centrality
A node is hub-central to the extent that its out-links are to nodes that have many in-links. Individuals or organizations that act as hubs are sending information to a wide range of others each of whom has many others reporting to them. Technically, an agent is hub-central if its out-links are to agents that have many other agents sending links to them. The scientific name of this measure is hub centrality and it is calculated on agent by agent matrices.
Input network(s): test
Rank Agent Value 1 Wayne 0.471 2 James 0.319 3 Mitchell 0.310 4 Logan 0.285 5 County 0.270 6 Hole 0.256 7 Waterloo 0.256 8 Perce 0.255 9 Klamath 0.255 10 Erie 0.250 Authority centrality
A node is authority-central to the extent that its in-links are from nodes that have many out-links. Individuals or organizations that act as authorities are receiving information from a wide range of others each of whom sends information to a large number of others. Technically, an agent is authority-central if its in-links are from agents that have are sending links to many others. The scientific name of this measure is authority centrality and it is calculated on agent by agent matrices.
Input network(s): test
Rank Agent Value 1 Wayne 0.457 2 James 0.319 3 Mitchell 0.311 4 Logan 0.286 5 County 0.268 6 Hole 0.256 7 Waterloo 0.256 8 Perce 0.255 9 Klamath 0.255 10 Erie 0.251 Information centrality
Calculate the Stephenson and Zelen information centrality measure for each node.
Input network(s): test
Rank Agent Value Unscaled 1 Wayne 0.006 0.036 2 Logan 0.006 0.036 3 James 0.006 0.036 4 Erie 0.006 0.036 5 Mitchell 0.006 0.036 6 Intl 0.006 0.036 7 Rockford 0.006 0.036 8 Hole 0.006 0.036 9 County 0.006 0.036 10 Roberts 0.006 0.036 Clique membership count
The number of distinct cliques to which each node belongs. Individuals or organizations who are high in number of cliques are those that belong to a large number of distinct cliques. A clique is defined as a group of three or more actors that have many connections to each other and relatively fewer connections to those in other groups. The scientific name of this measure is clique count and it is calculated on the agent by agent matrices.
Input network(s): test
Rank Agent Value 1 Logan 238.000 2 Intl 228.000 3 Rockford 219.000 4 Erie 199.000 5 Bend 173.000 6 Intll 164.000 7 Rapid 158.000 8 Gateway 147.000 9 Hole 140.000 10 Walla 138.000 Simmelian ties
The normalized number of Simmelian ties of each node.
Input network(s): test
Rank Agent Value Unscaled 1 Intl 0.442 102.000 2 Logan 0.437 101.000 3 Rockford 0.355 82.000 4 Erie 0.333 77.000 5 Gateway 0.320 74.000 6 Rapid 0.312 72.000 7 Bend 0.307 71.000 8 Intll 0.294 68.000 9 Hole 0.290 67.000 10 County 0.268 62.000 Clustering coefficient
Measures the degree of clustering in a network by averaging the clustering coefficient of each node, which is defined as the density of the node's ego network.
Input network(s): test
Rank Agent Value 1 Sitka 1.000 2 Ketchikan 1.000 3 Eastern 1.000 4 Creek 1.000 5 Long 1.000 6 Lake 1.000 7 Airfield 0.912 8 Missoula 0.902 9 Kent 0.895 10 Binghamton 0.890
Key Nodes Table
This shows the top scoring nodes side-by-side for selected measures.
Rank Betweenness centrality Closeness centrality Eigenvector centrality Eigenvector centrality per component In-degree centrality In-Closeness centrality Out-degree centrality Total degree centrality 1 Intl Intll Wayne Wayne Wayne Intl Wayne Wayne 2 Intll Muni James James Logan Intll Logan Logan 3 Muni Regional Mitchell Mitchell James Grand James James 4 Regional Intl Logan Logan Mitchell Nome Mitchell Mitchell 5 Grand Grand County County Erie Regional Erie Erie 6 Memorial Nome Hole Hole Rockford Mary's Rockford Rockford 7 Mitchell Mitchell Waterloo Waterloo Intl Mitchell Intl Intl 8 Field Akron-Canton Perce Perce Hole R Hole Hole 9 As Arcata Klamath Klamath Roberts Akron-Canton Roberts Roberts 10 Logan Mary's Erie Erie County Arcata County County