Calculates common social network measures on each selected input network.
Network test
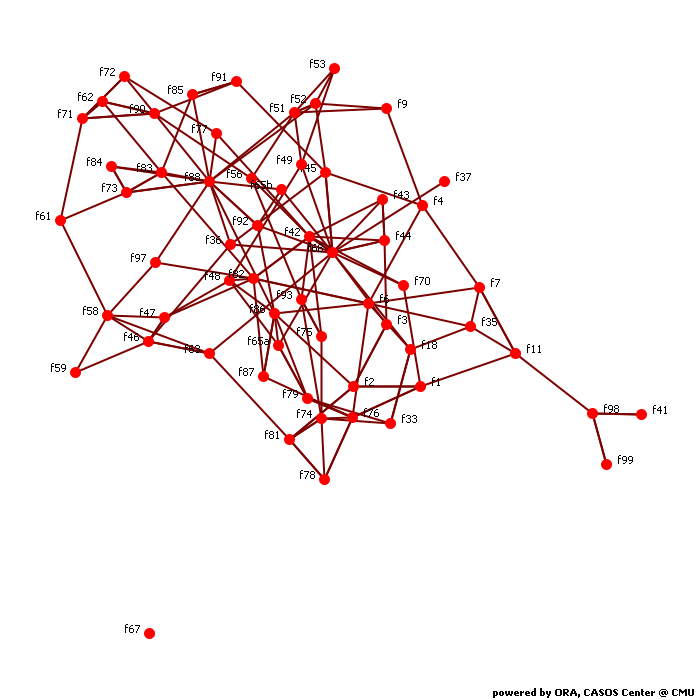
Network Level Measures
Measure Value Row count 60.000 Column count 60.000 Link count 161.000 Density 0.045 Components of 1 node (isolates) 1 Components of 2 nodes (dyadic isolates) 0 Components of 3 or more nodes 1 Reciprocity 0.258 Characteristic path length 4.087 Clustering coefficient 0.179 Network levels (diameter) 11.000 Network fragmentation 0.033 Krackhardt connectedness 0.967 Krackhardt efficiency 0.958 Krackhardt hierarchy 0.818 Krackhardt upperboundedness 0.794 Degree centralization 0.032 Betweenness centralization 0.066 Closeness centralization 0.018 Eigenvector centralization 0.428 Reciprocal (symmetric)? No (25% of the links are reciprocal)
Node Level Measures
Measure Min Max Avg Stddev Total degree centrality 0.000 0.051 0.020 0.011 Total degree centrality [Unscaled] 0.000 18.000 7.000 3.996 In-degree centrality 0.000 0.085 0.020 0.019 In-degree centrality [Unscaled] 0.000 15.000 3.500 3.399 Out-degree centrality 0.000 0.034 0.020 0.007 Out-degree centrality [Unscaled] 0.000 6.000 3.500 1.190 Eigenvector centrality 0.000 0.561 0.147 0.109 Eigenvector centrality [Unscaled] 0.000 0.396 0.104 0.077 Eigenvector centrality per component 0.000 0.390 0.102 0.076 Closeness centrality 0.006 0.018 0.010 0.003 Closeness centrality [Unscaled] 0.000 0.000 0.000 0.000 In-Closeness centrality 0.006 0.068 0.025 0.026 In-Closeness centrality [Unscaled] 0.000 0.001 0.000 0.000 Betweenness centrality 0.000 0.081 0.016 0.020 Betweenness centrality [Unscaled] 0.000 277.850 55.628 69.551 Hub centrality 0.000 0.553 0.139 0.118 Authority centrality 0.000 0.817 0.098 0.154 Information centrality 0.000 0.019 0.017 0.005 Information centrality [Unscaled] 0.000 0.000 0.000 0.000 Clique membership count 0.000 5.000 1.533 1.271 Simmelian ties 0.000 0.034 0.002 0.007 Simmelian ties [Unscaled] 0.000 2.000 0.100 0.436 Clustering coefficient 0.000 0.833 0.179 0.189
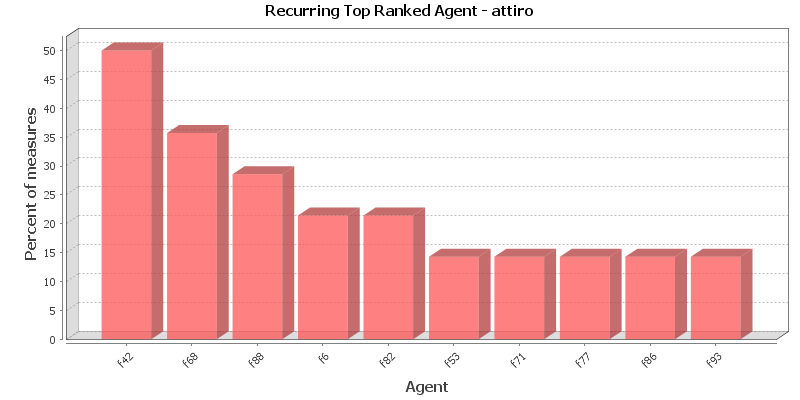
Key Nodes
This chart shows the Agent that is repeatedly top-ranked in the measures listed below. The value shown is the percentage of measures for which the Agent was ranked in the top three.
Total degree centrality
The Total Degree Centrality of a node is the normalized sum of its row and column degrees. Individuals or organizations who are "in the know" are those who are linked to many others and so, by virtue of their position have access to the ideas, thoughts, beliefs of many others. Individuals who are "in the know" are identified by degree centrality in the relevant social network. Those who are ranked high on this metrics have more connections to others in the same network. The scientific name of this measure is total degree centrality and it is calculated on the agent by agent matrices.
Input network: test (size: 60, density: 0.0454802)
Rank Agent Value Unscaled Context* 1 f68 0.051 18.000 0.200 2 f42 0.048 17.000 0.095 3 f88 0.048 17.000 0.095 4 f82 0.042 15.000 -0.116 5 f6 0.040 14.000 -0.221 6 f71 0.037 13.000 -0.326 7 f90 0.037 13.000 -0.326 8 f73 0.031 11.000 -0.536 9 f74 0.031 11.000 -0.536 10 f76 0.031 11.000 -0.536 * Number of standard deviations from the mean of a random network of the same size and density
Mean: 0.020 Mean in random network: 0.045 Std.dev: 0.011 Std.dev in random network: 0.027 In-degree centrality
The In Degree Centrality of a node is its normalized in-degree. For any node, e.g. an individual or a resource, the in-links are the connections that the node of interest receives from other nodes. For example, imagine an agent by knowledge matrix then the number of in-links a piece of knowledge has is the number of agents that are connected to. The scientific name of this measure is in-degree and it is calculated on the agent by agent matrices.
Input network(s): test
Rank Agent Value Unscaled 1 f68 0.085 15.000 2 f88 0.073 13.000 3 f42 0.068 12.000 4 f82 0.056 10.000 5 f6 0.051 9.000 6 f74 0.045 8.000 7 f86 0.045 8.000 8 f90 0.045 8.000 9 f71 0.040 7.000 10 f76 0.040 7.000 Out-degree centrality
For any node, e.g. an individual or a resource, the out-links are the connections that the node of interest sends to other nodes. For example, imagine an agent by knowledge matrix then the number of out-links an agent would have is the number of pieces of knowledge it is connected to. The scientific name of this measure is out-degree and it is calculated on the agent by agent matrices. Individuals or organizations who are high in most knowledge have more expertise or are associated with more types of knowledge than are others. If no sub-network connecting agents to knowledge exists, then this measure will not be calculated. The scientific name of this measure is out degree centrality and it is calculated on agent by knowledge matrices. Individuals or organizations who are high in "most resources" have more resources or are associated with more types of resources than are others. If no sub-network connecting agents to resources exists, then this measure will not be calculated. The scientific name of this measure is out degree centrality and it is calculated on agent by resource matrices.
Input network(s): test
Rank Agent Value Unscaled 1 f71 0.034 6.000 2 f78 0.034 6.000 3 f93 0.034 6.000 4 f4 0.028 5.000 5 f6 0.028 5.000 6 f42 0.028 5.000 7 f52 0.028 5.000 8 f62 0.028 5.000 9 f72 0.028 5.000 10 f73 0.028 5.000 Eigenvector centrality
Calculates the principal eigenvector of the network. A node is central to the extent that its neighbors are central. Leaders of strong cliques are individuals who or organizations who are collected to others that are themselves highly connected to each other. In other words, if you have a clique then the individual most connected to others in the clique and other cliques, is the leader of the clique. Individuals or organizations who are connected to many otherwise isolated individuals or organizations will have a much lower score in this measure then those that are connected to groups that have many connections themselves. The scientific name of this measure is eigenvector centrality and it is calculated on agent by agent matrices.
Input network: test (size: 60, density: 0.0454802)
Rank Agent Value Unscaled Context* 1 f42 0.561 0.396 0.220 2 f82 0.432 0.305 -0.279 3 f6 0.408 0.288 -0.373 4 f93 0.339 0.240 -0.636 5 f68 0.313 0.221 -0.740 6 f88 0.312 0.221 -0.743 7 f77 0.301 0.213 -0.787 8 f75 0.292 0.206 -0.821 9 f74 0.262 0.185 -0.938 10 f7 0.249 0.176 -0.988 * Number of standard deviations from the mean of a random network of the same size and density
Mean: 0.147 Mean in random network: 0.504 Std.dev: 0.109 Std.dev in random network: 0.258 Eigenvector centrality per component
Calculates the principal eigenvector of the network. A node is central to the extent that its neighbors are central. Each component is extracted as a separate network, Eigenvector Centrality is computed on it and scaled according to the component size. The scores are then combined into a single result vector.
Input network(s): test
Rank Agent Value 1 f42 0.390 2 f82 0.300 3 f6 0.283 4 f93 0.236 5 f68 0.218 6 f88 0.217 7 f77 0.209 8 f75 0.203 9 f74 0.182 10 f7 0.173 Closeness centrality
The average closeness of a node to the other nodes in a network (also called out-closeness). Loosely, Closeness is the inverse of the average distance in the network from the node to all other nodes.
Input network: test (size: 60, density: 0.0454802)
Rank Agent Value Unscaled Context* 1 f53 0.018 0.000 -3.818 2 f49 0.017 0.000 -3.847 3 f9 0.016 0.000 -3.895 4 f52 0.016 0.000 -3.895 5 f51 0.016 0.000 -3.896 6 f61 0.014 0.000 -3.951 7 f97 0.011 0.000 -4.021 8 f85 0.011 0.000 -4.022 9 f59 0.011 0.000 -4.023 10 f91 0.011 0.000 -4.023 * Number of standard deviations from the mean of a random network of the same size and density
Mean: 0.010 Mean in random network: 0.146 Std.dev: 0.003 Std.dev in random network: 0.033 In-Closeness centrality
The average closeness of a node from the other nodes in a network. Loosely, Closeness is the inverse of the average distance in the network to the node and from all other nodes.
Input network(s): test
Rank Agent Value Unscaled 1 f68 0.068 0.001 2 f86 0.066 0.001 3 f42 0.066 0.001 4 f2 0.065 0.001 5 f45 0.065 0.001 6 f44 0.064 0.001 7 f82 0.064 0.001 8 f1 0.064 0.001 9 f81 0.063 0.001 10 f76 0.063 0.001 Betweenness centrality
The Betweenness Centrality of node v in a network is defined as: across all node pairs that have a shortest path containing v, the percentage that pass through v. Individuals or organizations that are potentially influential are positioned to broker connections between groups and to bring to bear the influence of one group on another or serve as a gatekeeper between groups. This agent occurs on many of the shortest paths between other agents. The scientific name of this measure is betweenness centrality and it is calculated on agent by agent matrices.
Input network: test (size: 60, density: 0.0454802)
Rank Agent Value Unscaled Context* 1 f88 0.081 277.850 0.178 2 f86 0.078 267.733 0.165 3 f2 0.074 253.750 0.147 4 f68 0.071 242.167 0.131 5 f42 0.065 223.650 0.107 6 f76 0.055 186.567 0.059 7 f75 0.034 116.750 -0.033 8 f79 0.033 112.733 -0.038 9 f1 0.029 99.983 -0.055 10 f74 0.026 90.033 -0.068 * Number of standard deviations from the mean of a random network of the same size and density
Mean: 0.016 Mean in random network: 0.041 Std.dev: 0.020 Std.dev in random network: 0.223 Hub centrality
A node is hub-central to the extent that its out-links are to nodes that have many in-links. Individuals or organizations that act as hubs are sending information to a wide range of others each of whom has many others reporting to them. Technically, an agent is hub-central if its out-links are to agents that have many other agents sending links to them. The scientific name of this measure is hub centrality and it is calculated on agent by agent matrices.
Input network(s): test
Rank Agent Value 1 f82 0.553 2 f77 0.504 3 f93 0.493 4 f42 0.311 5 f7 0.281 6 f92 0.278 7 f6 0.270 8 f70 0.264 9 f43 0.240 10 f83 0.234 Authority centrality
A node is authority-central to the extent that its in-links are from nodes that have many out-links. Individuals or organizations that act as authorities are receiving information from a wide range of others each of whom sends information to a large number of others. Technically, an agent is authority-central if its in-links are from agents that have are sending links to many others. The scientific name of this measure is authority centrality and it is calculated on agent by agent matrices.
Input network(s): test
Rank Agent Value 1 f42 0.817 2 f6 0.517 3 f68 0.473 4 f88 0.451 5 f82 0.379 6 f74 0.325 7 f75 0.279 8 f86 0.228 9 f76 0.191 10 f73 0.172 Information centrality
Calculate the Stephenson and Zelen information centrality measure for each node.
Input network(s): test
Rank Agent Value Unscaled 1 f4 0.019 0.000 2 f77 0.019 0.000 3 f70 0.019 0.000 4 f52 0.019 0.000 5 f7 0.019 0.000 6 f18 0.019 0.000 7 f92 0.019 0.000 8 f36 0.019 0.000 9 f48 0.019 0.000 10 f51 0.019 0.000 Clique membership count
The number of distinct cliques to which each node belongs. Individuals or organizations who are high in number of cliques are those that belong to a large number of distinct cliques. A clique is defined as a group of three or more actors that have many connections to each other and relatively fewer connections to those in other groups. The scientific name of this measure is clique count and it is calculated on the agent by agent matrices.
Input network(s): test
Rank Agent Value 1 f68 5.000 2 f88 5.000 3 f42 4.000 4 f51 4.000 5 f6 3.000 6 f7 3.000 7 f35 3.000 8 f46 3.000 9 f52 3.000 10 f58 3.000 Simmelian ties
The normalized number of Simmelian ties of each node.
Input network(s): test
Rank Agent Value Unscaled 1 f62 0.034 2.000 2 f71 0.034 2.000 3 f90 0.034 2.000 Clustering coefficient
Measures the degree of clustering in a network by averaging the clustering coefficient of each node, which is defined as the density of the node's ego network.
Input network(s): test
Rank Agent Value 1 f43 0.833 2 f84 0.833 3 f53 0.500 4 f59 0.500 5 f65b 0.500 6 f78 0.500 7 f44 0.417 8 f3 0.333 9 f9 0.333 10 f35 0.333
Key Nodes Table
This shows the top scoring nodes side-by-side for selected measures.
Rank Betweenness centrality Closeness centrality Eigenvector centrality Eigenvector centrality per component In-degree centrality In-Closeness centrality Out-degree centrality Total degree centrality 1 f88 f53 f42 f42 f68 f68 f71 f68 2 f86 f49 f82 f82 f88 f86 f78 f42 3 f2 f9 f6 f6 f42 f42 f93 f88 4 f68 f52 f93 f93 f82 f2 f4 f82 5 f42 f51 f68 f68 f6 f45 f6 f6 6 f76 f61 f88 f88 f74 f44 f42 f71 7 f75 f97 f77 f77 f86 f82 f52 f90 8 f79 f85 f75 f75 f90 f1 f62 f73 9 f1 f59 f74 f74 f71 f81 f72 f74 10 f74 f91 f7 f7 f76 f76 f73 f76