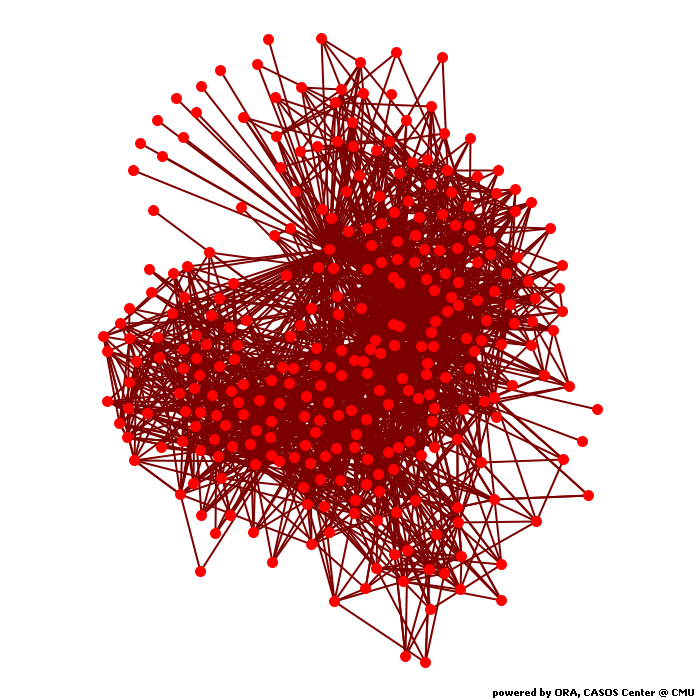
Calculates common social network measures on each selected input network.
Network agent x agent
Network Level Measures
Measure Value Row count 297.000 Column count 297.000 Link count 2345.000 Density 0.027 Components of 1 node (isolates) 0 Components of 2 nodes (dyadic isolates) 0 Components of 3 or more nodes 1 Reciprocity 0.092 Characteristic path length 5.907 Clustering coefficient 0.169 Network levels (diameter) 35.000 Network fragmentation 0.000 Krackhardt connectedness 1.000 Krackhardt efficiency 0.958 Krackhardt hierarchy 0.274 Krackhardt upperboundedness 0.904 Degree centralization 0.040 Betweenness centralization 0.099 Closeness centralization 0.000 Eigenvector centralization 0.867 Reciprocal (symmetric)? No (9% of the links are reciprocal)
Node Level Measures
Measure Min Max Avg Stddev Total degree centrality 0.000 0.041 0.001 0.003 Total degree centrality [Unscaled] 1.000 1689.000 59.253 110.633 In-degree centrality 0.000 0.082 0.001 0.005 In-degree centrality [Unscaled] 0.000 1689.000 29.626 103.377 Out-degree centrality 0.000 0.010 0.001 0.001 Out-degree centrality [Unscaled] 0.000 197.000 29.626 27.057 Eigenvector centrality 0.000 0.902 0.041 0.071 Eigenvector centrality [Unscaled] 0.000 0.638 0.029 0.050 Eigenvector centrality per component 0.000 0.638 0.029 0.050 Closeness centrality 0.000 0.000 0.000 0.000 Closeness centrality [Unscaled] 0.000 0.000 0.000 0.000 In-Closeness centrality 0.000 0.001 0.000 0.000 In-Closeness centrality [Unscaled] 0.000 0.000 0.000 0.000 Betweenness centrality 0.000 0.109 0.010 0.015 Betweenness centrality [Unscaled] 0.000 9491.337 836.291 1352.197 Hub centrality 0.000 0.246 0.045 0.069 Authority centrality 0.000 1.389 0.009 0.082 Information centrality 0.000 0.005 0.003 0.001 Information centrality [Unscaled] 0.000 7.040 5.028 1.687 Clique membership count 0.000 235.000 16.387 25.308 Simmelian ties 0.000 0.017 0.001 0.003 Simmelian ties [Unscaled] 0.000 5.000 0.290 0.835 Clustering coefficient 0.000 0.500 0.169 0.102
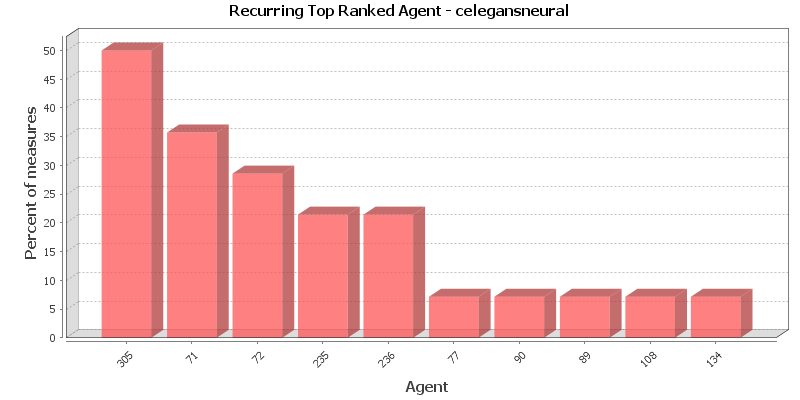
Key Nodes
This chart shows the Agent that is repeatedly top-ranked in the measures listed below. The value shown is the percentage of measures for which the Agent was ranked in the top three.
Total degree centrality
The Total Degree Centrality of a node is the normalized sum of its row and column degrees. Individuals or organizations who are "in the know" are those who are linked to many others and so, by virtue of their position have access to the ideas, thoughts, beliefs of many others. Individuals who are "in the know" are identified by degree centrality in the relevant social network. Those who are ranked high on this metrics have more connections to others in the same network. The scientific name of this measure is total degree centrality and it is calculated on the agent by agent matrices.
Input network: agent x agent (size: 297, density: 0.0266744)
Rank Agent Value Unscaled Context* 1 305 0.041 1689.000 1.506 2 71 0.013 527.000 -1.493 3 72 0.013 520.000 -1.511 4 198 0.006 240.000 -2.234 5 216 0.006 235.000 -2.246 6 78 0.006 228.000 -2.265 7 77 0.005 226.000 -2.270 8 217 0.005 226.000 -2.270 9 76 0.005 224.000 -2.275 10 75 0.005 196.000 -2.347 * Number of standard deviations from the mean of a random network of the same size and density
Mean: 0.001 Mean in random network: 0.027 Std.dev: 0.003 Std.dev in random network: 0.009 In-degree centrality
The In Degree Centrality of a node is its normalized in-degree. For any node, e.g. an individual or a resource, the in-links are the connections that the node of interest receives from other nodes. For example, imagine an agent by knowledge matrix then the number of in-links a piece of knowledge has is the number of agents that are connected to. The scientific name of this measure is in-degree and it is calculated on the agent by agent matrices.
Input network(s): agent x agent
Rank Agent Value Unscaled 1 305 0.082 1689.000 2 71 0.016 331.000 3 72 0.016 323.000 4 198 0.008 175.000 5 74 0.007 139.000 6 217 0.006 121.000 7 216 0.006 119.000 8 73 0.005 110.000 9 89 0.005 107.000 10 78 0.005 106.000 Out-degree centrality
For any node, e.g. an individual or a resource, the out-links are the connections that the node of interest sends to other nodes. For example, imagine an agent by knowledge matrix then the number of out-links an agent would have is the number of pieces of knowledge it is connected to. The scientific name of this measure is out-degree and it is calculated on the agent by agent matrices. Individuals or organizations who are high in most knowledge have more expertise or are associated with more types of knowledge than are others. If no sub-network connecting agents to knowledge exists, then this measure will not be calculated. The scientific name of this measure is out degree centrality and it is calculated on agent by knowledge matrices. Individuals or organizations who are high in "most resources" have more resources or are associated with more types of resources than are others. If no sub-network connecting agents to resources exists, then this measure will not be calculated. The scientific name of this measure is out degree centrality and it is calculated on agent by resource matrices.
Input network(s): agent x agent
Rank Agent Value Unscaled 1 72 0.010 197.000 2 71 0.009 196.000 3 75 0.006 124.000 4 76 0.006 124.000 5 77 0.006 122.000 6 78 0.006 122.000 7 216 0.006 116.000 8 217 0.005 105.000 9 179 0.005 94.000 10 180 0.005 94.000 Eigenvector centrality
Calculates the principal eigenvector of the network. A node is central to the extent that its neighbors are central. Leaders of strong cliques are individuals who or organizations who are collected to others that are themselves highly connected to each other. In other words, if you have a clique then the individual most connected to others in the clique and other cliques, is the leader of the clique. Individuals or organizations who are connected to many otherwise isolated individuals or organizations will have a much lower score in this measure then those that are connected to groups that have many connections themselves. The scientific name of this measure is eigenvector centrality and it is calculated on agent by agent matrices.
Input network: agent x agent (size: 297, density: 0.0266744)
Rank Agent Value Unscaled Context* 1 305 0.902 0.638 -2.809 2 236 0.181 0.128 -7.485 3 235 0.179 0.127 -7.499 4 252 0.177 0.125 -7.516 5 277 0.175 0.124 -7.525 6 72 0.174 0.123 -7.530 7 71 0.171 0.121 -7.553 8 276 0.171 0.121 -7.555 9 237 0.170 0.120 -7.556 10 279 0.168 0.119 -7.571 * Number of standard deviations from the mean of a random network of the same size and density
Mean: 0.041 Mean in random network: 1.335 Std.dev: 0.071 Std.dev in random network: 0.154 Eigenvector centrality per component
Calculates the principal eigenvector of the network. A node is central to the extent that its neighbors are central. Each component is extracted as a separate network, Eigenvector Centrality is computed on it and scaled according to the component size. The scores are then combined into a single result vector.
Input network(s): agent x agent
Rank Agent Value 1 305 0.638 2 236 0.128 3 235 0.127 4 252 0.125 5 277 0.124 6 72 0.123 7 71 0.121 8 276 0.121 9 237 0.120 10 279 0.119 Closeness centrality
The average closeness of a node to the other nodes in a network (also called out-closeness). Loosely, Closeness is the inverse of the average distance in the network from the node to all other nodes.
Input network: agent x agent (size: 297, density: 0.0266744)
Rank Agent Value Unscaled Context* 1 210 0.000 0.000 15.952 2 181 0.000 0.000 15.952 3 182 0.000 0.000 15.952 4 243 0.000 0.000 15.952 5 273 0.000 0.000 15.953 6 212 0.000 0.000 15.953 7 12 0.000 0.000 15.953 8 64 0.000 0.000 15.953 9 53 0.000 0.000 15.953 10 209 0.000 0.000 15.953 * Number of standard deviations from the mean of a random network of the same size and density
Mean: 0.000 Mean in random network: 0.271 Std.dev: 0.000 Std.dev in random network: -0.017 In-Closeness centrality
The average closeness of a node from the other nodes in a network. Loosely, Closeness is the inverse of the average distance in the network to the node and from all other nodes.
Input network(s): agent x agent
Rank Agent Value Unscaled 1 305 0.001 0.000 2 306 0.001 0.000 3 134 0.000 0.000 4 279 0.000 0.000 5 280 0.000 0.000 6 121 0.000 0.000 7 282 0.000 0.000 8 281 0.000 0.000 9 102 0.000 0.000 10 277 0.000 0.000 Betweenness centrality
The Betweenness Centrality of node v in a network is defined as: across all node pairs that have a shortest path containing v, the percentage that pass through v. Individuals or organizations that are potentially influential are positioned to broker connections between groups and to bring to bear the influence of one group on another or serve as a gatekeeper between groups. This agent occurs on many of the shortest paths between other agents. The scientific name of this measure is betweenness centrality and it is calculated on agent by agent matrices.
Input network: agent x agent (size: 297, density: 0.0266744)
Rank Agent Value Unscaled Context* 1 195 0.109 9491.337 2.167 2 178 0.107 9329.604 2.127 3 216 0.091 7962.229 1.791 4 196 0.075 6586.845 1.452 5 239 0.057 4970.447 1.054 6 81 0.052 4570.790 0.956 7 222 0.051 4411.103 0.917 8 217 0.047 4062.812 0.831 9 198 0.045 3949.599 0.803 10 238 0.045 3922.207 0.796 * Number of standard deviations from the mean of a random network of the same size and density
Mean: 0.010 Mean in random network: 0.008 Std.dev: 0.015 Std.dev in random network: 0.047 Hub centrality
A node is hub-central to the extent that its out-links are to nodes that have many in-links. Individuals or organizations that act as hubs are sending information to a wide range of others each of whom has many others reporting to them. Technically, an agent is hub-central if its out-links are to agents that have many other agents sending links to them. The scientific name of this measure is hub centrality and it is calculated on agent by agent matrices.
Input network(s): agent x agent
Rank Agent Value 1 252 0.246 2 235 0.235 3 236 0.235 4 258 0.232 5 237 0.232 6 187 0.230 7 188 0.230 8 234 0.230 9 238 0.230 10 239 0.229 Authority centrality
A node is authority-central to the extent that its in-links are from nodes that have many out-links. Individuals or organizations that act as authorities are receiving information from a wide range of others each of whom sends information to a large number of others. Technically, an agent is authority-central if its in-links are from agents that have are sending links to many others. The scientific name of this measure is authority centrality and it is calculated on agent by agent matrices.
Input network(s): agent x agent
Rank Agent Value 1 305 1.389 2 277 0.096 3 276 0.091 4 279 0.086 5 275 0.079 6 281 0.076 7 274 0.065 8 278 0.063 9 153 0.060 10 280 0.056 Information centrality
Calculate the Stephenson and Zelen information centrality measure for each node.
Input network(s): agent x agent
Rank Agent Value Unscaled 1 72 0.005 7.040 2 71 0.005 7.039 3 77 0.005 6.906 4 78 0.005 6.904 5 75 0.005 6.896 6 76 0.005 6.896 7 216 0.005 6.868 8 217 0.005 6.824 9 179 0.005 6.776 10 180 0.005 6.768 Clique membership count
The number of distinct cliques to which each node belongs. Individuals or organizations who are high in number of cliques are those that belong to a large number of distinct cliques. A clique is defined as a group of three or more actors that have many connections to each other and relatively fewer connections to those in other groups. The scientific name of this measure is clique count and it is calculated on the agent by agent matrices.
Input network(s): agent x agent
Rank Agent Value 1 305 235.000 2 73 154.000 3 71 153.000 4 72 145.000 5 74 131.000 6 217 106.000 7 75 98.000 8 216 98.000 9 76 97.000 10 78 82.000 Simmelian ties
The normalized number of Simmelian ties of each node.
Input network(s): agent x agent
Rank Agent Value Unscaled 1 89 0.017 5.000 2 90 0.014 4.000 3 108 0.014 4.000 4 149 0.014 4.000 5 222 0.010 3.000 6 99 0.010 3.000 7 100 0.010 3.000 8 139 0.010 3.000 9 180 0.010 3.000 10 219 0.010 3.000 Clustering coefficient
Measures the degree of clustering in a network by averaging the clustering coefficient of each node, which is defined as the density of the node's ego network.
Input network(s): agent x agent
Rank Agent Value 1 65 0.500 2 191 0.500 3 267 0.500 4 268 0.500 5 215 0.486 6 66 0.450 7 50 0.417 8 231 0.417 9 233 0.417 10 183 0.403
Key Nodes Table
This shows the top scoring nodes side-by-side for selected measures.
Rank Betweenness centrality Closeness centrality Eigenvector centrality Eigenvector centrality per component In-degree centrality In-Closeness centrality Out-degree centrality Total degree centrality 1 195 210 305 305 305 305 72 305 2 178 181 236 236 71 306 71 71 3 216 182 235 235 72 134 75 72 4 196 243 252 252 198 279 76 198 5 239 273 277 277 74 280 77 216 6 81 212 72 72 217 121 78 78 7 222 12 71 71 216 282 216 77 8 217 64 276 276 73 281 217 217 9 198 53 237 237 89 102 179 76 10 238 209 279 279 78 277 180 75