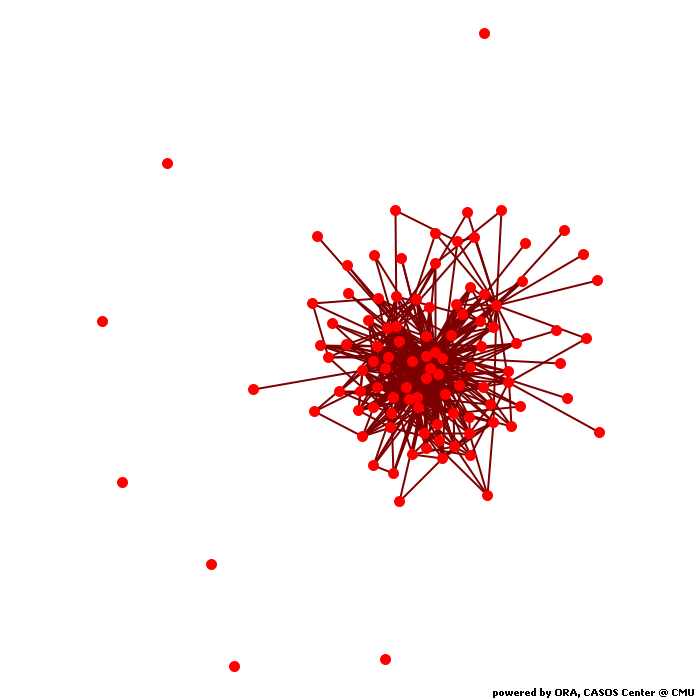
Calculates common social network measures on each selected input network.
Network test
Network Level Measures
Measure Value Row count 105.000 Column count 105.000 Link count 525.000 Density 0.048 Components of 1 node (isolates) 7 Components of 2 nodes (dyadic isolates) 0 Components of 3 or more nodes 1 Reciprocity 0.012 Characteristic path length 2.364 Clustering coefficient 0.248 Network levels (diameter) 6.000 Network fragmentation 0.129 Krackhardt connectedness 0.871 Krackhardt efficiency 0.909 Krackhardt hierarchy 0.960 Krackhardt upperboundedness 0.757 Degree centralization 0.121 Betweenness centralization 0.109 Closeness centralization 0.019 Eigenvector centralization 0.323 Reciprocal (symmetric)? No (1% of the links are reciprocal)
Node Level Measures
Measure Min Max Avg Stddev Total degree centrality 0.000 0.144 0.024 0.028 Total degree centrality [Unscaled] 0.000 60.000 10.210 11.685 In-degree centrality 0.000 0.162 0.024 0.029 In-degree centrality [Unscaled] 0.000 34.000 5.114 6.024 Out-degree centrality 0.000 0.257 0.024 0.046 Out-degree centrality [Unscaled] 0.000 54.000 5.114 9.585 Eigenvector centrality 0.000 0.417 0.101 0.094 Eigenvector centrality [Unscaled] 0.000 0.295 0.071 0.067 Eigenvector centrality per component 0.000 0.275 0.067 0.062 Closeness centrality 0.005 0.017 0.007 0.003 Closeness centrality [Unscaled] 0.000 0.000 0.000 0.000 In-Closeness centrality 0.005 0.016 0.007 0.002 In-Closeness centrality [Unscaled] 0.000 0.000 0.000 0.000 Betweenness centrality 0.000 0.111 0.003 0.014 Betweenness centrality [Unscaled] 0.000 1187.493 35.093 147.549 Hub centrality 0.000 0.592 0.068 0.120 Authority centrality 0.000 0.425 0.097 0.098 Information centrality 0.000 0.021 0.010 0.006 Information centrality [Unscaled] 0.000 2.302 1.038 0.672 Clique membership count 0.000 148.000 12.171 24.651 Simmelian ties 0.000 0.000 0.000 0.000 Simmelian ties [Unscaled] 0.000 0.000 0.000 0.000 Clustering coefficient 0.000 1.000 0.248 0.207
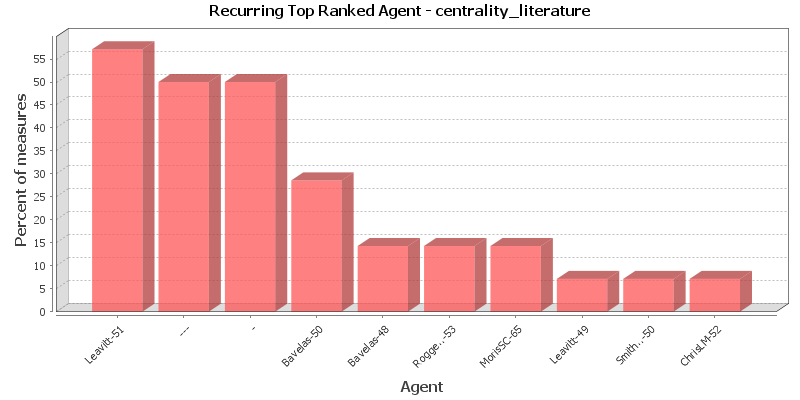
Key Nodes
This chart shows the Agent that is repeatedly top-ranked in the measures listed below. The value shown is the percentage of measures for which the Agent was ranked in the top three.
Total degree centrality
The Total Degree Centrality of a node is the normalized sum of its row and column degrees. Individuals or organizations who are "in the know" are those who are linked to many others and so, by virtue of their position have access to the ideas, thoughts, beliefs of many others. Individuals who are "in the know" are identified by degree centrality in the relevant social network. Those who are ranked high on this metrics have more connections to others in the same network. The scientific name of this measure is total degree centrality and it is calculated on the agent by agent matrices.
Input network: test (size: 105, density: 0.047619)
Rank Agent Value Unscaled Context* 1 --- 0.144 60.000 4.615 2 Leavitt-51 0.132 55.000 4.040 3 - 0.132 55.000 4.040 4 Bavelas-50 0.108 45.000 2.889 5 Rogge..-53 0.093 39.000 2.198 6 LuceMCH-53 0.079 33.000 1.507 7 Bavelas-48 0.072 30.000 1.162 8 Goldber-55 0.062 26.000 0.702 9 MorisSC-65 0.062 26.000 0.702 10 ChrisLM-52 0.060 25.000 0.587 * Number of standard deviations from the mean of a random network of the same size and density
Mean: 0.024 Mean in random network: 0.048 Std.dev: 0.028 Std.dev in random network: 0.021 In-degree centrality
The In Degree Centrality of a node is its normalized in-degree. For any node, e.g. an individual or a resource, the in-links are the connections that the node of interest receives from other nodes. For example, imagine an agent by knowledge matrix then the number of in-links a piece of knowledge has is the number of agents that are connected to. The scientific name of this measure is in-degree and it is calculated on the agent by agent matrices.
Input network(s): test
Rank Agent Value Unscaled 1 --- 0.162 34.000 2 MorisSC-65 0.124 26.000 3 - 0.100 21.000 4 RobyL..A57 0.100 21.000 5 GuetzkD-57 0.081 17.000 6 Flament-63 0.081 17.000 7 63 0.076 16.000 8 93 0.062 13.000 9 Beaucha-65 0.062 13.000 10 ShawR..-56 0.057 12.000 Out-degree centrality
For any node, e.g. an individual or a resource, the out-links are the connections that the node of interest sends to other nodes. For example, imagine an agent by knowledge matrix then the number of out-links an agent would have is the number of pieces of knowledge it is connected to. The scientific name of this measure is out-degree and it is calculated on the agent by agent matrices. Individuals or organizations who are high in most knowledge have more expertise or are associated with more types of knowledge than are others. If no sub-network connecting agents to knowledge exists, then this measure will not be calculated. The scientific name of this measure is out degree centrality and it is calculated on agent by knowledge matrices. Individuals or organizations who are high in "most resources" have more resources or are associated with more types of resources than are others. If no sub-network connecting agents to resources exists, then this measure will not be calculated. The scientific name of this measure is out degree centrality and it is calculated on agent by resource matrices.
Input network(s): test
Rank Agent Value Unscaled 1 Leavitt-51 0.257 54.000 2 Bavelas-50 0.214 45.000 3 Rogge..-53 0.171 36.000 4 - 0.167 35.000 5 Bavelas-48 0.143 30.000 6 LuceMCH-53 0.138 29.000 7 --- 0.129 27.000 8 Goldber-55 0.110 23.000 9 HeiseM.-51 0.090 19.000 10 ChrisLM-52 0.086 18.000 Eigenvector centrality
Calculates the principal eigenvector of the network. A node is central to the extent that its neighbors are central. Leaders of strong cliques are individuals who or organizations who are collected to others that are themselves highly connected to each other. In other words, if you have a clique then the individual most connected to others in the clique and other cliques, is the leader of the clique. Individuals or organizations who are connected to many otherwise isolated individuals or organizations will have a much lower score in this measure then those that are connected to groups that have many connections themselves. The scientific name of this measure is eigenvector centrality and it is calculated on agent by agent matrices.
Input network: test (size: 105, density: 0.047619)
Rank Agent Value Unscaled Context* 1 --- 0.417 0.295 -0.470 2 Leavitt-51 0.410 0.290 -0.507 3 - 0.397 0.281 -0.566 4 Rogge..-53 0.363 0.257 -0.723 5 Bavelas-50 0.314 0.222 -0.954 6 LuceMCH-53 0.289 0.204 -1.072 7 RobyL..A57 0.260 0.184 -1.205 8 Bavelas-48 0.244 0.173 -1.281 9 Goldber-55 0.236 0.167 -1.318 10 ChristM-54 0.232 0.164 -1.336 * Number of standard deviations from the mean of a random network of the same size and density
Mean: 0.101 Mean in random network: 0.518 Std.dev: 0.094 Std.dev in random network: 0.214 Eigenvector centrality per component
Calculates the principal eigenvector of the network. A node is central to the extent that its neighbors are central. Each component is extracted as a separate network, Eigenvector Centrality is computed on it and scaled according to the component size. The scores are then combined into a single result vector.
Input network(s): test
Rank Agent Value 1 --- 0.275 2 Leavitt-51 0.270 3 - 0.262 4 Rogge..-53 0.240 5 Bavelas-50 0.207 6 LuceMCH-53 0.191 7 RobyL..A57 0.172 8 Bavelas-48 0.161 9 Goldber-55 0.156 10 ChristM-54 0.153 Closeness centrality
The average closeness of a node to the other nodes in a network (also called out-closeness). Loosely, Closeness is the inverse of the average distance in the network from the node to all other nodes.
Input network: test (size: 105, density: 0.047619)
Rank Agent Value Unscaled Context* 1 Bavelas-48 0.017 0.000 -4.330 2 Leavitt-51 0.014 0.000 -4.374 3 Bavelas-50 0.014 0.000 -4.389 4 HeiseM.-51 0.012 0.000 -4.415 5 Leavitt-49 0.011 0.000 -4.443 6 LuceMCH-53 0.010 0.000 -4.449 7 Smith..-50 0.010 0.000 -4.450 8 Smith..-51 0.010 0.000 -4.450 9 Luce...-51 0.010 0.000 -4.450 10 ChrisLM-52 0.010 0.000 -4.453 * Number of standard deviations from the mean of a random network of the same size and density
Mean: 0.007 Mean in random network: 0.246 Std.dev: 0.003 Std.dev in random network: 0.053 In-Closeness centrality
The average closeness of a node from the other nodes in a network. Loosely, Closeness is the inverse of the average distance in the network to the node and from all other nodes.
Input network(s): test
Rank Agent Value Unscaled 1 MorisSC-65 0.016 0.000 2 Carzo..-63 0.011 0.000 3 Flament-63 0.010 0.000 4 93 0.010 0.000 5 Beaucha-65 0.010 0.000 6 ShurRLT-62 0.010 0.000 7 Mulder.B60 0.010 0.000 8 Cohen.-C64 0.010 0.000 9 Mulder.A60 0.010 0.000 10 MacKenz-64 0.010 0.000 Betweenness centrality
The Betweenness Centrality of node v in a network is defined as: across all node pairs that have a shortest path containing v, the percentage that pass through v. Individuals or organizations that are potentially influential are positioned to broker connections between groups and to bring to bear the influence of one group on another or serve as a gatekeeper between groups. This agent occurs on many of the shortest paths between other agents. The scientific name of this measure is betweenness centrality and it is calculated on agent by agent matrices.
Input network: test (size: 105, density: 0.047619)
Rank Agent Value Unscaled Context* 1 --- 0.111 1187.493 0.447 2 - 0.085 909.142 0.317 3 ChrisLM-52 0.022 236.847 0.001 4 RobyL..A57 0.016 166.638 -0.032 5 ShawR..-56 0.014 151.944 -0.039 6 Mulder.-56 0.012 125.500 -0.051 7 64 0.011 119.000 -0.054 8 Hirota.-53 0.010 108.500 -0.059 9 Mulder.A59 0.008 86.518 -0.070 10 FlamentB56 0.007 78.583 -0.073 * Number of standard deviations from the mean of a random network of the same size and density
Mean: 0.003 Mean in random network: 0.022 Std.dev: 0.014 Std.dev in random network: 0.199 Hub centrality
A node is hub-central to the extent that its out-links are to nodes that have many in-links. Individuals or organizations that act as hubs are sending information to a wide range of others each of whom has many others reporting to them. Technically, an agent is hub-central if its out-links are to agents that have many other agents sending links to them. The scientific name of this measure is hub centrality and it is calculated on agent by agent matrices.
Input network(s): test
Rank Agent Value 1 Leavitt-51 0.592 2 Rogge..-53 0.547 3 Bavelas-50 0.494 4 - 0.440 5 LuceMCH-53 0.380 6 Bavelas-48 0.349 7 Goldber-55 0.340 8 --- 0.306 9 HeiseM.-51 0.285 10 MacyCL.-53 0.265 Authority centrality
A node is authority-central to the extent that its in-links are from nodes that have many out-links. Individuals or organizations that act as authorities are receiving information from a wide range of others each of whom sends information to a large number of others. Technically, an agent is authority-central if its in-links are from agents that have are sending links to many others. The scientific name of this measure is authority centrality and it is calculated on agent by agent matrices.
Input network(s): test
Rank Agent Value 1 --- 0.425 2 RobyL..A57 0.378 3 GuetzkD-57 0.348 4 63 0.348 5 - 0.313 6 Mulder.A59 0.280 7 ShawR..-56 0.266 8 Flament-63 0.254 9 40 0.229 10 68 0.226 Information centrality
Calculate the Stephenson and Zelen information centrality measure for each node.
Input network(s): test
Rank Agent Value Unscaled 1 Leavitt-51 0.021 2.302 2 Bavelas-50 0.021 2.282 3 - 0.021 2.256 4 Rogge..-53 0.021 2.254 5 Bavelas-48 0.020 2.226 6 LuceMCH-53 0.020 2.221 7 --- 0.020 2.219 8 Goldber-55 0.020 2.178 9 HeiseM.-51 0.020 2.136 10 ChrisLM-52 0.020 2.131 Clique membership count
The number of distinct cliques to which each node belongs. Individuals or organizations who are high in number of cliques are those that belong to a large number of distinct cliques. A clique is defined as a group of three or more actors that have many connections to each other and relatively fewer connections to those in other groups. The scientific name of this measure is clique count and it is calculated on the agent by agent matrices.
Input network(s): test
Rank Agent Value 1 Leavitt-51 148.000 2 - 138.000 3 --- 119.000 4 Bavelas-50 67.000 5 LuceMCH-53 62.000 6 Rogge..-53 46.000 7 Bavelas-48 41.000 8 Goldber-55 40.000 9 RobyL..A57 37.000 10 Mulder.A59 31.000 Simmelian ties
The normalized number of Simmelian ties of each node.
Input network(s): test
Rank Agent Value Unscaled 1 All nodes have this value 0.000 Clustering coefficient
Measures the degree of clustering in a network by averaging the clustering coefficient of each node, which is defined as the density of the node's ego network.
Input network(s): test
Rank Agent Value 1 Walker.-54 1.000 2 Karanef-54 1.000 3 Shaw...-58 1.000 4 Mulder.-58 1.000 5 Guetzko-51 0.667 6 #FlamentA58 0.667 7 Shaw...C54 0.500 8 Trow...-57 0.500 9 McWhinn-64 0.449 10 Lawson.A64 0.449
Key Nodes Table
This shows the top scoring nodes side-by-side for selected measures.
Rank Betweenness centrality Closeness centrality Eigenvector centrality Eigenvector centrality per component In-degree centrality In-Closeness centrality Out-degree centrality Total degree centrality 1 --- Bavelas-48 --- --- --- MorisSC-65 Leavitt-51 --- 2 - Leavitt-51 Leavitt-51 Leavitt-51 MorisSC-65 Carzo..-63 Bavelas-50 Leavitt-51 3 ChrisLM-52 Bavelas-50 - - - Flament-63 Rogge..-53 - 4 RobyL..A57 HeiseM.-51 Rogge..-53 Rogge..-53 RobyL..A57 93 - Bavelas-50 5 ShawR..-56 Leavitt-49 Bavelas-50 Bavelas-50 GuetzkD-57 Beaucha-65 Bavelas-48 Rogge..-53 6 Mulder.-56 LuceMCH-53 LuceMCH-53 LuceMCH-53 Flament-63 ShurRLT-62 LuceMCH-53 LuceMCH-53 7 64 Smith..-50 RobyL..A57 RobyL..A57 63 Mulder.B60 --- Bavelas-48 8 Hirota.-53 Smith..-51 Bavelas-48 Bavelas-48 93 Cohen.-C64 Goldber-55 Goldber-55 9 Mulder.A59 Luce...-51 Goldber-55 Goldber-55 Beaucha-65 Mulder.A60 HeiseM.-51 MorisSC-65 10 FlamentB56 ChrisLM-52 ChristM-54 ChristM-54 ShawR..-56 MacKenz-64 ChrisLM-52 ChrisLM-52