Calculates common social network measures on each selected input network.
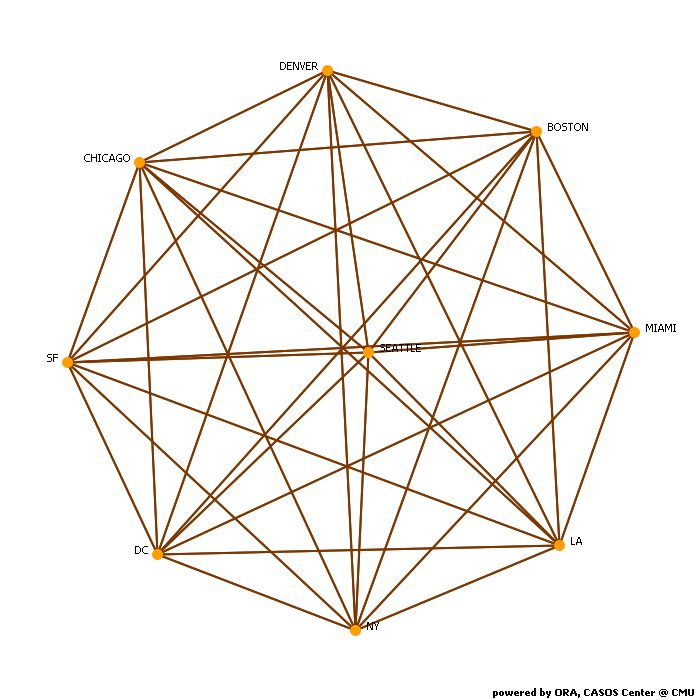
Network location x location
Network Level Measures
Measure Value Row count 9.000 Column count 9.000 Link count 36.000 Density 1.000 Components of 1 node (isolates) 0 Components of 2 nodes (dyadic isolates) 0 Components of 3 or more nodes 1 Reciprocity 1.000 Characteristic path length 1770.250 Clustering coefficient 1.000 Network levels (diameter) 3273.000 Network fragmentation 0.000 Krackhardt connectedness 1.000 Krackhardt efficiency 0.000 Krackhardt hierarchy 0.000 Krackhardt upperboundedness 1.000 Degree centralization 0.140 Betweenness centralization 0.049 Closeness centralization 0.075 Eigenvector centralization 0.095 Reciprocal (symmetric)? Yes
Node Level Measures
Measure Min Max Avg Stddev Total degree centrality 0.419 0.650 0.541 0.081 Total degree centrality [Unscaled] 10970.000 17007.000 14162.000 2132.269 In-degree centrality 0.419 0.650 0.541 0.081 In-degree centrality [Unscaled] 10970.000 17007.000 14162.000 2132.269 Out-degree centrality 0.419 0.650 0.541 0.081 Out-degree centrality [Unscaled] 10970.000 17007.000 14162.000 2132.269 Eigenvector centrality 0.377 0.541 0.468 0.059 Eigenvector centrality [Unscaled] 0.266 0.383 0.331 0.041 Eigenvector centrality per component 0.266 0.383 0.331 0.041 Closeness centrality 0.097 0.150 0.119 0.018 Closeness centrality [Unscaled] 0.000 0.000 0.000 0.000 In-Closeness centrality 0.097 0.150 0.119 0.018 In-Closeness centrality [Unscaled] 0.000 0.000 0.000 0.000 Betweenness centrality 0.000 0.054 0.010 0.019 Betweenness centrality [Unscaled] 0.000 1.500 0.278 0.533 Hub centrality 0.377 0.541 0.468 0.059 Authority centrality 0.377 0.541 0.468 0.059 Information centrality 0.098 0.122 0.111 0.008 Information centrality [Unscaled] 7621.190 9467.454 8619.215 652.222 Clique membership count 1.000 1.000 1.000 0.000 Simmelian ties 1.000 1.000 1.000 0.000 Simmelian ties [Unscaled] 8.000 8.000 8.000 0.000 Clustering coefficient 1.000 1.000 1.000 0.000
Key Nodes
This chart shows the Location that is repeatedly top-ranked in the measures listed below. The value shown is the percentage of measures for which the Location was ranked in the top three.

Total degree centrality
The Total Degree Centrality of a node is the normalized sum of its row and column degrees. Individuals or organizations who are "in the know" are those who are linked to many others and so, by virtue of their position have access to the ideas, thoughts, beliefs of many others. Individuals who are "in the know" are identified by degree centrality in the relevant social network. Those who are ranked high on this metrics have more connections to others in the same network. The scientific name of this measure is total degree centrality and it is calculated on the agent by agent matrices.
Input network: location x location (size: 9, density: 1)
Rank Location Value Unscaled Context* 1 SEATTLE 0.650 17007.000 -1.#IO 2 SF 0.628 16445.000 -1.#IO 3 MIAMI 0.621 16265.999 -1.#IO 4 LA 0.600 15705.999 -1.#IO 5 BOSTON 0.539 14101.000 -1.#IO 6 NY 0.491 12855.000 -1.#IO 7 DC 0.464 12138.000 -1.#IO 8 DENVER 0.457 11970.000 -1.#IO 9 CHICAGO 0.419 10970.000 -1.#IO * Number of standard deviations from the mean of a random network of the same size and density
Mean: 0.541 Mean in random network: 1.000 Std.dev: 0.081 Std.dev in random network: 0.000 In-degree centrality
The In Degree Centrality of a node is its normalized in-degree. For any node, e.g. an individual or a resource, the in-links are the connections that the node of interest receives from other nodes. For example, imagine an agent by knowledge matrix then the number of in-links a piece of knowledge has is the number of agents that are connected to. The scientific name of this measure is in-degree and it is calculated on the agent by agent matrices.
Input network(s): location x location
Rank Location Value Unscaled 1 SEATTLE 0.650 17007.000 2 SF 0.628 16445.000 3 MIAMI 0.621 16265.999 4 LA 0.600 15705.999 5 BOSTON 0.539 14101.000 6 NY 0.491 12855.000 7 DC 0.464 12138.000 8 DENVER 0.457 11970.000 9 CHICAGO 0.419 10970.000 Out-degree centrality
For any node, e.g. an individual or a resource, the out-links are the connections that the node of interest sends to other nodes. For example, imagine an agent by knowledge matrix then the number of out-links an agent would have is the number of pieces of knowledge it is connected to. The scientific name of this measure is out-degree and it is calculated on the agent by agent matrices. Individuals or organizations who are high in most knowledge have more expertise or are associated with more types of knowledge than are others. If no sub-network connecting agents to knowledge exists, then this measure will not be calculated. The scientific name of this measure is out degree centrality and it is calculated on agent by knowledge matrices. Individuals or organizations who are high in "most resources" have more resources or are associated with more types of resources than are others. If no sub-network connecting agents to resources exists, then this measure will not be calculated. The scientific name of this measure is out degree centrality and it is calculated on agent by resource matrices.
Input network(s): location x location
Rank Location Value Unscaled 1 SEATTLE 0.650 17007.000 2 SF 0.628 16445.000 3 MIAMI 0.621 16265.999 4 LA 0.600 15705.999 5 BOSTON 0.539 14101.000 6 NY 0.491 12855.000 7 DC 0.464 12138.000 8 DENVER 0.457 11970.000 9 CHICAGO 0.419 10970.000 Eigenvector centrality
Calculates the principal eigenvector of the network. A node is central to the extent that its neighbors are central. Leaders of strong cliques are individuals who or organizations who are collected to others that are themselves highly connected to each other. In other words, if you have a clique then the individual most connected to others in the clique and other cliques, is the leader of the clique. Individuals or organizations who are connected to many otherwise isolated individuals or organizations will have a much lower score in this measure then those that are connected to groups that have many connections themselves. The scientific name of this measure is eigenvector centrality and it is calculated on agent by agent matrices.
Input network: location x location (size: 9, density: 1)
Rank Location Value Unscaled Context* 1 SEATTLE 0.541 0.383 -4.259 2 MIAMI 0.538 0.380 -4.296 3 SF 0.521 0.368 -4.477 4 LA 0.499 0.353 -4.702 5 BOSTON 0.480 0.339 -4.903 6 NY 0.440 0.311 -5.324 7 DC 0.416 0.294 -5.573 8 DENVER 0.398 0.281 -5.769 9 CHICAGO 0.377 0.266 -5.989 * Number of standard deviations from the mean of a random network of the same size and density
Mean: 0.468 Mean in random network: 0.946 Std.dev: 0.059 Std.dev in random network: 0.095 Eigenvector centrality per component
Calculates the principal eigenvector of the network. A node is central to the extent that its neighbors are central. Each component is extracted as a separate network, Eigenvector Centrality is computed on it and scaled according to the component size. The scores are then combined into a single result vector.
Input network(s): location x location
Rank Location Value 1 SEATTLE 0.383 2 MIAMI 0.380 3 SF 0.368 4 LA 0.353 5 BOSTON 0.339 6 NY 0.311 7 DC 0.294 8 DENVER 0.281 9 CHICAGO 0.266 Closeness centrality
The average closeness of a node to the other nodes in a network (also called out-closeness). Loosely, Closeness is the inverse of the average distance in the network from the node to all other nodes.
Input network: location x location (size: 9, density: 1)
Rank Location Value Unscaled Context* 1 CHICAGO 0.150 0.000 -105.442 2 DENVER 0.138 0.000 -107.299 3 DC 0.136 0.000 -107.581 4 NY 0.128 0.000 -108.702 5 BOSTON 0.117 0.000 -110.378 6 LA 0.105 0.000 -112.145 7 MIAMI 0.101 0.000 -112.680 8 SF 0.100 0.000 -112.843 9 SEATTLE 0.097 0.000 -113.333 * Number of standard deviations from the mean of a random network of the same size and density
Mean: 0.119 Mean in random network: 0.863 Std.dev: 0.018 Std.dev in random network: 0.007 In-Closeness centrality
The average closeness of a node from the other nodes in a network. Loosely, Closeness is the inverse of the average distance in the network to the node and from all other nodes.
Input network(s): location x location
Rank Location Value Unscaled 1 CHICAGO 0.150 0.000 2 DENVER 0.138 0.000 3 DC 0.136 0.000 4 NY 0.128 0.000 5 BOSTON 0.117 0.000 6 LA 0.105 0.000 7 MIAMI 0.101 0.000 8 SF 0.100 0.000 9 SEATTLE 0.097 0.000 Betweenness centrality
The Betweenness Centrality of node v in a network is defined as: across all node pairs that have a shortest path containing v, the percentage that pass through v. Individuals or organizations that are potentially influential are positioned to broker connections between groups and to bring to bear the influence of one group on another or serve as a gatekeeper between groups. This agent occurs on many of the shortest paths between other agents. The scientific name of this measure is betweenness centrality and it is calculated on agent by agent matrices.
Input network: location x location (size: 9, density: 1)
Rank Location Value Unscaled Context* 1 CHICAGO 0.054 1.500 1.408 2 DC 0.036 1.000 1.165 * Number of standard deviations from the mean of a random network of the same size and density
Mean: 0.010 Mean in random network: -0.050 Std.dev: 0.019 Std.dev in random network: 0.073 Hub centrality
A node is hub-central to the extent that its out-links are to nodes that have many in-links. Individuals or organizations that act as hubs are sending information to a wide range of others each of whom has many others reporting to them. Technically, an agent is hub-central if its out-links are to agents that have many other agents sending links to them. The scientific name of this measure is hub centrality and it is calculated on agent by agent matrices.
Input network(s): location x location
Rank Location Value 1 SEATTLE 0.541 2 MIAMI 0.538 3 SF 0.521 4 LA 0.499 5 BOSTON 0.480 6 NY 0.440 7 DC 0.416 8 DENVER 0.398 9 CHICAGO 0.377 Authority centrality
A node is authority-central to the extent that its in-links are from nodes that have many out-links. Individuals or organizations that act as authorities are receiving information from a wide range of others each of whom sends information to a large number of others. Technically, an agent is authority-central if its in-links are from agents that have are sending links to many others. The scientific name of this measure is authority centrality and it is calculated on agent by agent matrices.
Input network(s): location x location
Rank Location Value 1 SEATTLE 0.541 2 MIAMI 0.538 3 SF 0.521 4 LA 0.499 5 BOSTON 0.480 6 NY 0.440 7 DC 0.416 8 DENVER 0.398 9 CHICAGO 0.377 Information centrality
Calculate the Stephenson and Zelen information centrality measure for each node.
Input network(s): location x location
Rank Location Value Unscaled 1 SEATTLE 0.122 9467.454 2 SF 0.120 9295.018 3 MIAMI 0.120 9288.505 4 LA 0.118 9116.117 5 BOSTON 0.111 8598.877 6 NY 0.106 8198.756 7 DENVER 0.103 8017.905 8 DC 0.103 7969.109 9 CHICAGO 0.098 7621.190 Clique membership count
The number of distinct cliques to which each node belongs. Individuals or organizations who are high in number of cliques are those that belong to a large number of distinct cliques. A clique is defined as a group of three or more actors that have many connections to each other and relatively fewer connections to those in other groups. The scientific name of this measure is clique count and it is calculated on the agent by agent matrices.
Input network(s): location x location
Rank Location Value 1 All nodes have this value 1.000 Simmelian ties
The normalized number of Simmelian ties of each node.
Input network(s): location x location
Rank Location Value Unscaled 1 All nodes have this value 1.000 Clustering coefficient
Measures the degree of clustering in a network by averaging the clustering coefficient of each node, which is defined as the density of the node's ego network.
Input network(s): location x location
Rank Location Value 1 All nodes have this value 1.000
Key Nodes Table
This shows the top scoring nodes side-by-side for selected measures.
Rank Betweenness centrality Closeness centrality Eigenvector centrality Eigenvector centrality per component In-degree centrality In-Closeness centrality Out-degree centrality Total degree centrality 1 CHICAGO CHICAGO SEATTLE SEATTLE SEATTLE CHICAGO SEATTLE SEATTLE 2 DC DENVER MIAMI MIAMI SF DENVER SF SF 3 BOSTON DC SF SF MIAMI DC MIAMI MIAMI 4 NY NY LA LA LA NY LA LA 5 MIAMI BOSTON BOSTON BOSTON BOSTON BOSTON BOSTON BOSTON 6 SEATTLE LA NY NY NY LA NY NY 7 SF MIAMI DC DC DC MIAMI DC DC 8 LA SF DENVER DENVER DENVER SF DENVER DENVER 9 DENVER SEATTLE CHICAGO CHICAGO CHICAGO SEATTLE CHICAGO CHICAGO