Calculates common social network measures on each selected input network.
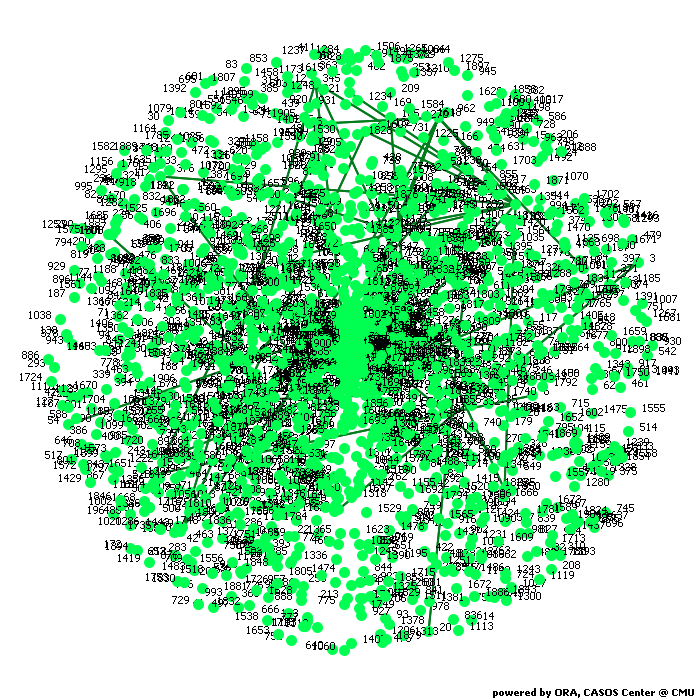
Network agent x agent
Block Model - Newman's Clustering Algorithm
Network Level Measures
Measure Value Row count 40421.000 Column count 40421.000 Link count 175691.000 Density 0.000 Components of 1 node (isolates) 844 Components of 2 nodes (dyadic isolates) 461 Components of 3 or more nodes 493 Reciprocity 1.000 Characteristic path length 1.774 Clustering coefficient 0.636 Network levels (diameter) 21.895 Network fragmentation 0.186 Krackhardt connectedness 0.814 Krackhardt efficiency 1.000 Krackhardt hierarchy 0.000 Krackhardt upperboundedness 1.000 Degree centralization 0.000 Betweenness centralization 0.038 Closeness centralization 0.000 Reciprocal (symmetric)? Yes
Node Level Measures
Measure Min Max Avg Stddev Total degree centrality 0.000 0.000 0.000 0.000 Total degree centrality [Unscaled] 0.000 190.000 4.420 7.795 In-degree centrality 0.000 0.000 0.000 0.000 In-degree centrality [Unscaled] 0.000 190.000 4.420 7.795 Out-degree centrality 0.000 0.000 0.000 0.000 Out-degree centrality [Unscaled] 0.000 190.000 4.420 7.795 Eigenvector centrality per component 0.000 0.617 0.000 0.004 Closeness centrality 0.000 0.000 0.000 0.000 Closeness centrality [Unscaled] 0.000 0.000 0.000 0.000 In-Closeness centrality 0.000 0.000 0.000 0.000 In-Closeness centrality [Unscaled] 0.000 0.000 0.000 0.000 Betweenness centrality 0.000 0.038 0.000 0.001 Betweenness centrality [Unscaled] 0.000 31354376.000 104350.252 591757.953 Hub centrality 0.000 0.967 0.000 0.007 Authority centrality 0.000 0.967 0.000 0.007 Clique membership count 0.000 371.000 3.264 8.471 Simmelian ties 0.000 0.007 0.000 0.000 Simmelian ties [Unscaled] 0.000 278.000 8.407 12.694 Clustering coefficient 0.000 1.000 0.636 0.384
Key Nodes
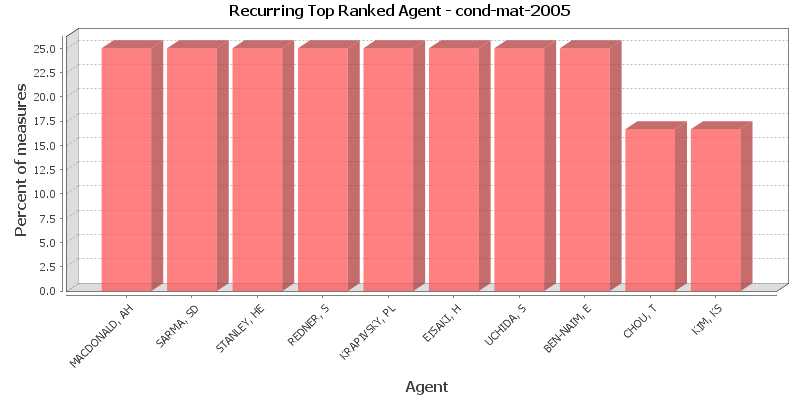
This chart shows the Agent that is repeatedly top-ranked in the measures listed below. The value shown is the percentage of measures for which the Agent was ranked in the top three.
Total degree centrality
The Total Degree Centrality of a node is the normalized sum of its row and column degrees. Individuals or organizations who are "in the know" are those who are linked to many others and so, by virtue of their position have access to the ideas, thoughts, beliefs of many others. Individuals who are "in the know" are identified by degree centrality in the relevant social network. Those who are ranked high on this metrics have more connections to others in the same network. The scientific name of this measure is total degree centrality and it is calculated on the agent by agent matrices.
Input network: agent x agent (size: 40421, density: 0.000215068)
Rank Agent Value Unscaled Context* 1 SARMA, SD 0.000 190.000 -1.548 2 MACDONALD, AH 0.000 161.000 -1.762 3 STANLEY, HE 0.000 159.000 -1.776 4 PARISI, G 0.000 155.000 -1.806 5 SORNETTE, D 0.000 131.000 -1.983 6 PFEIFFER, LN 0.000 128.000 -2.005 7 WEST, KW 0.000 125.000 -2.027 8 SCHEFFLER, M 0.000 119.000 -2.071 9 PEETERS, FM 0.000 117.000 -2.086 10 BOUCHAUD, JP 0.000 116.000 -2.093 * Number of standard deviations from the mean of a random network of the same size and density
Mean: 0.000 Mean in random network: 0.000 Std.dev: 0.000 Std.dev in random network: 0.000 In-degree centrality
The In Degree Centrality of a node is its normalized in-degree. For any node, e.g. an individual or a resource, the in-links are the connections that the node of interest receives from other nodes. For example, imagine an agent by knowledge matrix then the number of in-links a piece of knowledge has is the number of agents that are connected to. The scientific name of this measure is in-degree and it is calculated on the agent by agent matrices.
Input network(s): agent x agent
Rank Agent Value Unscaled 1 SARMA, SD 0.000 190.000 2 MACDONALD, AH 0.000 161.000 3 STANLEY, HE 0.000 159.000 4 PARISI, G 0.000 155.000 5 SORNETTE, D 0.000 131.000 6 PFEIFFER, LN 0.000 128.000 7 WEST, KW 0.000 125.000 8 SCHEFFLER, M 0.000 119.000 9 PEETERS, FM 0.000 117.000 10 BOUCHAUD, JP 0.000 116.000 Out-degree centrality
For any node, e.g. an individual or a resource, the out-links are the connections that the node of interest sends to other nodes. For example, imagine an agent by knowledge matrix then the number of out-links an agent would have is the number of pieces of knowledge it is connected to. The scientific name of this measure is out-degree and it is calculated on the agent by agent matrices. Individuals or organizations who are high in most knowledge have more expertise or are associated with more types of knowledge than are others. If no sub-network connecting agents to knowledge exists, then this measure will not be calculated. The scientific name of this measure is out degree centrality and it is calculated on agent by knowledge matrices. Individuals or organizations who are high in "most resources" have more resources or are associated with more types of resources than are others. If no sub-network connecting agents to resources exists, then this measure will not be calculated. The scientific name of this measure is out degree centrality and it is calculated on agent by resource matrices.
Input network(s): agent x agent
Rank Agent Value Unscaled 1 SARMA, SD 0.000 190.000 2 MACDONALD, AH 0.000 161.000 3 STANLEY, HE 0.000 159.000 4 PARISI, G 0.000 155.000 5 SORNETTE, D 0.000 131.000 6 PFEIFFER, LN 0.000 128.000 7 WEST, KW 0.000 125.000 8 SCHEFFLER, M 0.000 119.000 9 PEETERS, FM 0.000 117.000 10 BOUCHAUD, JP 0.000 116.000 Eigenvector centrality per component
Calculates the principal eigenvector of the network. A node is central to the extent that its neighbors are central. Each component is extracted as a separate network, Eigenvector Centrality is computed on it and scaled according to the component size. The scores are then combined into a single result vector.
Input network(s): agent x agent
Rank Agent Value 1 KRAPIVSKY, PL 0.617 2 BEN-NAIM, E 0.483 3 REDNER, S 0.404 4 FRACHEBOURG, L 0.101 5 MAJUMDAR, SN 0.095 6 ISPOLATOV, I 0.067 7 HWANG, W 0.038 8 SPIRIN, V 0.032 9 LEYVRAZ, F 0.030 10 MENDES, JFF 0.030 Closeness centrality
The average closeness of a node to the other nodes in a network (also called out-closeness). Loosely, Closeness is the inverse of the average distance in the network from the node to all other nodes.
Input network: agent x agent (size: 40421, density: 0.000215068)
Rank Agent Value Unscaled Context* 1 All nodes have this value 0.000 * Number of standard deviations from the mean of a random network of the same size and density
Mean: 0.000 Mean in random network: 176.888 Std.dev: 0.000 Std.dev in random network: 168.332 In-Closeness centrality
The average closeness of a node from the other nodes in a network. Loosely, Closeness is the inverse of the average distance in the network to the node and from all other nodes.
Input network(s): agent x agent
Rank Agent Value Unscaled 1 All nodes have this value 0.000 Betweenness centrality
The Betweenness Centrality of node v in a network is defined as: across all node pairs that have a shortest path containing v, the percentage that pass through v. Individuals or organizations that are potentially influential are positioned to broker connections between groups and to bring to bear the influence of one group on another or serve as a gatekeeper between groups. This agent occurs on many of the shortest paths between other agents. The scientific name of this measure is betweenness centrality and it is calculated on agent by agent matrices.
Input network: agent x agent (size: 40421, density: 0.000215068)
Rank Agent Value Unscaled Context* 1 UCHIDA, S 0.038 31354376.000 0.002 2 EISAKI, H 0.036 29656096.000 0.002 3 REVCOLEVSCHI, A 0.030 24648088.000 0.001 4 TAJIMA, S 0.028 22841246.000 0.001 5 KIM, KH 0.027 22007918.000 0.001 6 TOKURA, Y 0.023 18454992.000 0.001 7 TROYER, M 0.021 16788836.000 0.001 8 ANDO, Y 0.020 16270834.000 0.001 9 GREVEN, M 0.020 15977447.000 0.001 10 CHEONG, SW 0.018 14494543.000 0.001 * Number of standard deviations from the mean of a random network of the same size and density
Mean: 0.000 Mean in random network: -0.002 Std.dev: 0.001 Std.dev in random network: 21.702 Hub centrality
A node is hub-central to the extent that its out-links are to nodes that have many in-links. Individuals or organizations that act as hubs are sending information to a wide range of others each of whom has many others reporting to them. Technically, an agent is hub-central if its out-links are to agents that have many other agents sending links to them. The scientific name of this measure is hub centrality and it is calculated on agent by agent matrices.
Input network(s): agent x agent
Rank Agent Value 1 KRAPIVSKY, PL 0.967 2 BEN-NAIM, E 0.757 3 REDNER, S 0.633 4 FRACHEBOURG, L 0.159 5 MAJUMDAR, SN 0.150 6 ISPOLATOV, I 0.105 7 HWANG, W 0.060 8 SPIRIN, V 0.050 9 LEYVRAZ, F 0.047 10 MENDES, JFF 0.047 Authority centrality
A node is authority-central to the extent that its in-links are from nodes that have many out-links. Individuals or organizations that act as authorities are receiving information from a wide range of others each of whom sends information to a large number of others. Technically, an agent is authority-central if its in-links are from agents that have are sending links to many others. The scientific name of this measure is authority centrality and it is calculated on agent by agent matrices.
Input network(s): agent x agent
Rank Agent Value 1 KRAPIVSKY, PL 0.967 2 BEN-NAIM, E 0.757 3 REDNER, S 0.633 4 FRACHEBOURG, L 0.159 5 MAJUMDAR, SN 0.150 6 ISPOLATOV, I 0.105 7 HWANG, W 0.060 8 SPIRIN, V 0.050 9 LEYVRAZ, F 0.047 10 MENDES, JFF 0.047 Clique membership count
The number of distinct cliques to which each node belongs. Individuals or organizations who are high in number of cliques are those that belong to a large number of distinct cliques. A clique is defined as a group of three or more actors that have many connections to each other and relatively fewer connections to those in other groups. The scientific name of this measure is clique count and it is calculated on the agent by agent matrices.
Input network(s): agent x agent
Rank Agent Value 1 UCHIDA, S 371.000 2 EISAKI, H 286.000 3 SARRAO, JL 274.000 4 TOKURA, Y 259.000 5 ANDO, Y 227.000 6 YAMADA, K 225.000 7 CHEONG, SW 215.000 8 LYNN, JW 212.000 9 THOMPSON, JD 207.000 10 SHIRANE, G 199.000 Simmelian ties
The normalized number of Simmelian ties of each node.
Input network(s): agent x agent
Rank Agent Value Unscaled 1 UCHIDA, S 0.007 278.000 2 EISAKI, H 0.007 272.000 3 TOKURA, Y 0.006 243.000 4 SARRAO, JL 0.006 229.000 5 TAJIMA, S 0.005 222.000 6 CHEONG, SW 0.005 217.000 7 LEE, SI 0.005 217.000 8 CANFIELD, PC 0.005 216.000 9 REVCOLEVSCHI, A 0.005 213.000 10 UEDA, Y 0.005 197.000 Clustering coefficient
Measures the degree of clustering in a network by averaging the clustering coefficient of each node, which is defined as the density of the node's ego network.
Input network(s): agent x agent
Rank Agent Value 1 JACQUOD, PRJ 1.000 2 LAROCHELLE, DA 1.000 3 GARRISON, JE 1.000 4 NAGARAJ, B 1.000 5 IGAMI, M 1.000 6 BRUCHER, E 1.000 7 PENN, DR 1.000 8 CARMI, R 1.000 9 KILIN, D 1.000 10 CORREIA, S 1.000
Key Nodes Table
This shows the top scoring nodes side-by-side for selected measures.
Rank Betweenness centrality Closeness centrality Eigenvector centrality Eigenvector centrality per component In-degree centrality In-Closeness centrality Out-degree centrality Total degree centrality 1 UCHIDA, S CHOU, T - KRAPIVSKY, PL SARMA, SD CHOU, T SARMA, SD SARMA, SD 2 EISAKI, H KIM, KS - BEN-NAIM, E MACDONALD, AH KIM, KS MACDONALD, AH MACDONALD, AH 3 REVCOLEVSCHI, A OSTER, G - REDNER, S STANLEY, HE OSTER, G STANLEY, HE STANLEY, HE 4 TAJIMA, S COLEMAN, P - FRACHEBOURG, L PARISI, G COLEMAN, P PARISI, G PARISI, G 5 KIM, KH PEPIN, C - MAJUMDAR, SN SORNETTE, D PEPIN, C SORNETTE, D SORNETTE, D 6 TOKURA, Y TSVELIK, AM - ISPOLATOV, I PFEIFFER, LN TSVELIK, AM PFEIFFER, LN PFEIFFER, LN 7 TROYER, M VISHWANATH, A - HWANG, W WEST, KW VISHWANATH, A WEST, KW WEST, KW 8 ANDO, Y SENTHIL, T - SPIRIN, V SCHEFFLER, M SENTHIL, T SCHEFFLER, M SCHEFFLER, M 9 GREVEN, M YAMAMOTO, S - LEYVRAZ, F PEETERS, FM YAMAMOTO, S PEETERS, FM PEETERS, FM 10 CHEONG, SW FUKUI, T - MENDES, JFF BOUCHAUD, JP FUKUI, T BOUCHAUD, JP BOUCHAUD, JP