Calculates common social network measures on each selected input network.
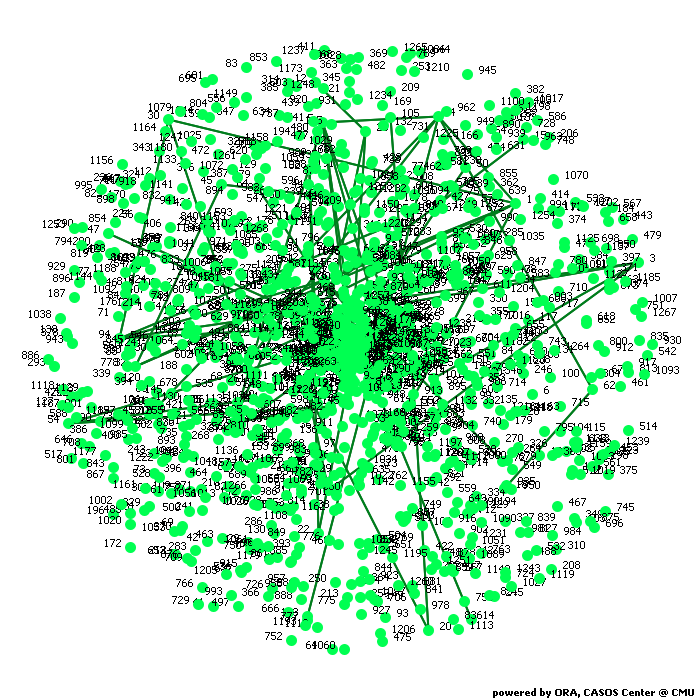
Network agent x agent
Block Model - Newman's Clustering Algorithm
Network Level Measures
Measure Value Row count 16726.000 Column count 16726.000 Link count 47594.000 Density 0.000 Components of 1 node (isolates) 462 Components of 2 nodes (dyadic isolates) 338 Components of 3 or more nodes 388 Reciprocity 1.000 Characteristic path length 2.782 Clustering coefficient 0.620 Network levels (diameter) 24.833 Network fragmentation 0.313 Krackhardt connectedness 0.687 Krackhardt efficiency 1.000 Krackhardt hierarchy 0.000 Krackhardt upperboundedness 1.000 Degree centralization 0.000 Betweenness centralization 0.056 Closeness centralization 0.000 Reciprocal (symmetric)? Yes
Node Level Measures
Measure Min Max Avg Stddev Total degree centrality 0.000 0.000 0.000 0.000 Total degree centrality [Unscaled] 0.000 95.000 3.254 4.598 In-degree centrality 0.000 0.000 0.000 0.000 In-degree centrality [Unscaled] 0.000 95.000 3.254 4.598 Out-degree centrality 0.000 0.000 0.000 0.000 Out-degree centrality [Unscaled] 0.000 95.000 3.254 4.598 Closeness centrality 0.000 0.000 0.000 0.000 Closeness centrality [Unscaled] 0.000 0.000 0.000 0.000 In-Closeness centrality 0.000 0.000 0.000 0.000 In-Closeness centrality [Unscaled] 0.000 0.000 0.000 0.000 Betweenness centrality 0.000 0.056 0.000 0.002 Betweenness centrality [Unscaled] 0.000 7822343.000 44666.023 216517.887 Clique membership count 0.000 57.000 1.878 2.787 Simmelian ties 0.000 0.006 0.000 0.000 Simmelian ties [Unscaled] 0.000 107.000 5.342 6.405 Clustering coefficient 0.000 1.000 0.620 0.403
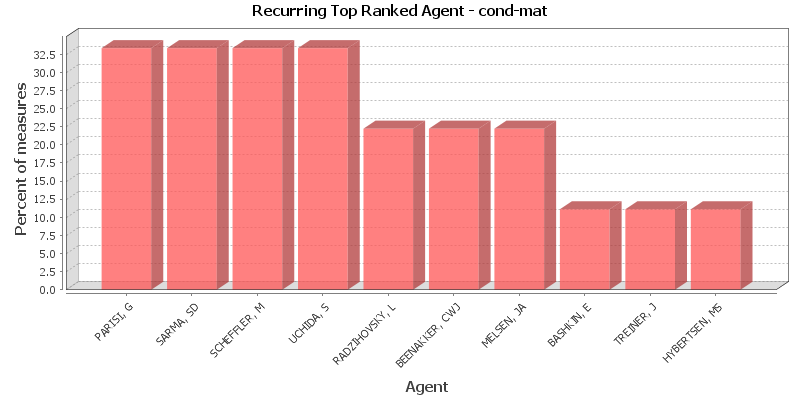
Key Nodes
This chart shows the Agent that is repeatedly top-ranked in the measures listed below. The value shown is the percentage of measures for which the Agent was ranked in the top three.
Total degree centrality
The Total Degree Centrality of a node is the normalized sum of its row and column degrees. Individuals or organizations who are "in the know" are those who are linked to many others and so, by virtue of their position have access to the ideas, thoughts, beliefs of many others. Individuals who are "in the know" are identified by degree centrality in the relevant social network. Those who are ranked high on this metrics have more connections to others in the same network. The scientific name of this measure is total degree centrality and it is calculated on the agent by agent matrices.
Input network: agent x agent (size: 16726, density: 0.00034027)
Rank Agent Value Unscaled Context* 1 PARISI, G 0.000 95.000 -0.603 2 SCHEFFLER, M 0.000 79.000 -0.903 3 SARMA, SD 0.000 74.000 -0.997 4 STANLEY, HE 0.000 74.000 -0.997 5 MACDONALD, AH 0.000 64.000 -1.185 6 SORNETTE, D 0.000 57.000 -1.316 7 DAGOTTO, E 0.000 52.000 -1.410 8 BEENAKKER, CWJ 0.000 51.000 -1.429 9 BINDER, K 0.000 47.000 -1.504 10 SCHREIBER, M 0.000 46.000 -1.522 * Number of standard deviations from the mean of a random network of the same size and density
Mean: 0.000 Mean in random network: 0.000 Std.dev: 0.000 Std.dev in random network: 0.000 In-degree centrality
The In Degree Centrality of a node is its normalized in-degree. For any node, e.g. an individual or a resource, the in-links are the connections that the node of interest receives from other nodes. For example, imagine an agent by knowledge matrix then the number of in-links a piece of knowledge has is the number of agents that are connected to. The scientific name of this measure is in-degree and it is calculated on the agent by agent matrices.
Input network(s): agent x agent
Rank Agent Value Unscaled 1 PARISI, G 0.000 95.000 2 SCHEFFLER, M 0.000 79.000 3 SARMA, SD 0.000 74.000 4 STANLEY, HE 0.000 74.000 5 MACDONALD, AH 0.000 64.000 6 SORNETTE, D 0.000 57.000 7 DAGOTTO, E 0.000 52.000 8 BEENAKKER, CWJ 0.000 51.000 9 BINDER, K 0.000 47.000 10 SCHREIBER, M 0.000 46.000 Out-degree centrality
For any node, e.g. an individual or a resource, the out-links are the connections that the node of interest sends to other nodes. For example, imagine an agent by knowledge matrix then the number of out-links an agent would have is the number of pieces of knowledge it is connected to. The scientific name of this measure is out-degree and it is calculated on the agent by agent matrices. Individuals or organizations who are high in most knowledge have more expertise or are associated with more types of knowledge than are others. If no sub-network connecting agents to knowledge exists, then this measure will not be calculated. The scientific name of this measure is out degree centrality and it is calculated on agent by knowledge matrices. Individuals or organizations who are high in "most resources" have more resources or are associated with more types of resources than are others. If no sub-network connecting agents to resources exists, then this measure will not be calculated. The scientific name of this measure is out degree centrality and it is calculated on agent by resource matrices.
Input network(s): agent x agent
Rank Agent Value Unscaled 1 PARISI, G 0.000 95.000 2 SCHEFFLER, M 0.000 79.000 3 SARMA, SD 0.000 74.000 4 STANLEY, HE 0.000 74.000 5 MACDONALD, AH 0.000 64.000 6 SORNETTE, D 0.000 57.000 7 DAGOTTO, E 0.000 52.000 8 BEENAKKER, CWJ 0.000 51.000 9 BINDER, K 0.000 47.000 10 SCHREIBER, M 0.000 46.000 Closeness centrality
The average closeness of a node to the other nodes in a network (also called out-closeness). Loosely, Closeness is the inverse of the average distance in the network from the node to all other nodes.
Input network: agent x agent (size: 16726, density: 0.00034027)
Rank Agent Value Unscaled Context* 1 All nodes have this value 0.000 * Number of standard deviations from the mean of a random network of the same size and density
Mean: 0.000 Mean in random network: 29.859 Std.dev: 0.000 Std.dev in random network: 26.741 In-Closeness centrality
The average closeness of a node from the other nodes in a network. Loosely, Closeness is the inverse of the average distance in the network to the node and from all other nodes.
Input network(s): agent x agent
Rank Agent Value Unscaled 1 All nodes have this value 0.000 Betweenness centrality
The Betweenness Centrality of node v in a network is defined as: across all node pairs that have a shortest path containing v, the percentage that pass through v. Individuals or organizations that are potentially influential are positioned to broker connections between groups and to bring to bear the influence of one group on another or serve as a gatekeeper between groups. This agent occurs on many of the shortest paths between other agents. The scientific name of this measure is betweenness centrality and it is calculated on agent by agent matrices.
Input network: agent x agent (size: 16726, density: 0.00034027)
Rank Agent Value Unscaled Context* 1 UCHIDA, S 0.056 7822343.000 0.007 2 ISOBE, M 0.050 6976137.500 0.006 3 ANISIMOV, VI 0.042 5898664.000 0.005 4 CANFIELD, PC 0.040 5641485.000 0.005 5 UEDA, Y 0.037 5202280.500 0.004 6 KOROTIN, MA 0.037 5118845.000 0.004 7 JOHNSTON, DC 0.033 4587205.500 0.004 8 CHEONG, S 0.032 4486566.000 0.004 9 EISAKI, H 0.030 4210643.000 0.004 10 REVCOLEVSCHI, A 0.030 4147031.750 0.004 * Number of standard deviations from the mean of a random network of the same size and density
Mean: 0.000 Mean in random network: -0.002 Std.dev: 0.002 Std.dev in random network: 8.860 Clique membership count
The number of distinct cliques to which each node belongs. Individuals or organizations who are high in number of cliques are those that belong to a large number of distinct cliques. A clique is defined as a group of three or more actors that have many connections to each other and relatively fewer connections to those in other groups. The scientific name of this measure is clique count and it is calculated on the agent by agent matrices.
Input network(s): agent x agent
Rank Agent Value 1 STANLEY, HE 57.000 2 SHIRANE, G 52.000 3 UCHIDA, S 45.000 4 MACDONALD, AH 40.000 5 PARISI, G 40.000 6 DAGOTTO, E 40.000 7 SCHEFFLER, M 39.000 8 POILBLANC, D 38.000 9 SARMA, SD 38.000 10 BISHOP, AR 37.000 Simmelian ties
The normalized number of Simmelian ties of each node.
Input network(s): agent x agent
Rank Agent Value Unscaled 1 UCHIDA, S 0.006 107.000 2 UEDA, Y 0.006 103.000 3 REVCOLEVSCHI, A 0.006 96.000 4 EISAKI, H 0.006 94.000 5 CHEONG, S 0.005 84.000 6 ISOBE, M 0.005 82.000 7 STANLEY, HE 0.005 77.000 8 SHIRANE, G 0.005 76.000 9 MENOVSKY, AA 0.005 76.000 10 SCHEFFLER, M 0.004 69.000 Clustering coefficient
Measures the degree of clustering in a network by averaging the clustering coefficient of each node, which is defined as the density of the node's ego network.
Input network(s): agent x agent
Rank Agent Value 1 BASHKIN, E 1.000 2 TREINER, J 1.000 3 HYBERTSEN, MS 1.000 4 CLARKE, P 1.000 5 ARNDT, PF 1.000 6 SJOSTRAND, J 1.000 7 JENSEN, J 1.000 8 KETOJA, JA 1.000 9 LEVIEN, R 1.000 10 STEPHENS, PW 1.000
Key Nodes Table
This shows the top scoring nodes side-by-side for selected measures.
Rank Betweenness centrality Closeness centrality Eigenvector centrality Eigenvector centrality per component In-degree centrality In-Closeness centrality Out-degree centrality Total degree centrality 1 UCHIDA, S RADZIHOVSKY, L - - PARISI, G RADZIHOVSKY, L PARISI, G PARISI, G 2 ISOBE, M BEENAKKER, CWJ - - SCHEFFLER, M BEENAKKER, CWJ SCHEFFLER, M SCHEFFLER, M 3 ANISIMOV, VI MELSEN, JA - - SARMA, SD MELSEN, JA SARMA, SD SARMA, SD 4 CANFIELD, PC BROUWER, PW - - STANLEY, HE BROUWER, PW STANLEY, HE STANLEY, HE 5 UEDA, Y JONG, MJMD - - MACDONALD, AH JONG, MJMD MACDONALD, AH MACDONALD, AH 6 KOROTIN, MA CIRILLO, ENM - - SORNETTE, D CIRILLO, ENM SORNETTE, D SORNETTE, D 7 JOHNSTON, DC GONNELLA, G - - DAGOTTO, E GONNELLA, G DAGOTTO, E DAGOTTO, E 8 CHEONG, S HALDANE, FDM - - BEENAKKER, CWJ HALDANE, FDM BEENAKKER, CWJ BEENAKKER, CWJ 9 EISAKI, H BASHKIN, E - - BINDER, K BASHKIN, E BINDER, K BINDER, K 10 REVCOLEVSCHI, A PAVLOFF, N - - SCHREIBER, M PAVLOFF, N SCHREIBER, M SCHREIBER, M