Calculates common social network measures on each selected input network.
Network test
Block Model - Newman's Clustering Algorithm
Network Level Measures
Measure Value Row count 1390.000 Column count 1390.000 Link count 1732.000 Density 0.001 Components of 1 node (isolates) 0 Components of 2 nodes (dyadic isolates) 36 Components of 3 or more nodes 15 Reciprocity 0.002 Characteristic path length 7.765 Clustering coefficient 0.006 Network levels (diameter) 24.000 Network fragmentation 0.169 Krackhardt connectedness 0.831 Krackhardt efficiency 1.000 Krackhardt hierarchy 0.948 Krackhardt upperboundedness 0.838 Degree centralization 0.016 Betweenness centralization 0.039 Closeness centralization 0.002 Eigenvector centralization 0.506 Reciprocal (symmetric)? No (0% of the links are reciprocal)
Node Level Measures
Measure Min Max Avg Stddev Total degree centrality 0.000 0.017 0.001 0.001 Total degree centrality [Unscaled] 1.000 46.000 2.492 3.604 In-degree centrality 0.000 0.014 0.001 0.001 In-degree centrality [Unscaled] 0.000 20.000 1.246 1.430 Out-degree centrality 0.000 0.032 0.001 0.002 Out-degree centrality [Unscaled] 0.000 45.000 1.246 2.852 Eigenvector centrality 0.000 0.521 0.016 0.034 Eigenvector centrality [Unscaled] 0.000 0.369 0.012 0.024 Eigenvector centrality per component 0.000 0.336 0.011 0.022 Closeness centrality 0.001 0.002 0.001 0.000 Closeness centrality [Unscaled] 0.000 0.000 0.000 0.000 In-Closeness centrality 0.001 0.001 0.001 0.000 In-Closeness centrality [Unscaled] 0.000 0.000 0.000 0.000 Betweenness centrality 0.000 0.040 0.001 0.003 Betweenness centrality [Unscaled] 0.000 76348.484 1272.847 5863.278 Hub centrality 0.000 1.341 0.004 0.038 Authority centrality 0.000 0.342 0.009 0.037 Information centrality 0.000 0.004 0.001 0.001 Information centrality [Unscaled] 0.000 3.152 0.543 0.735 Clique membership count 0.000 11.000 0.099 0.579 Simmelian ties 0.000 0.000 0.000 0.000 Simmelian ties [Unscaled] 0.000 0.000 0.000 0.000 Clustering coefficient 0.000 0.500 0.006 0.047
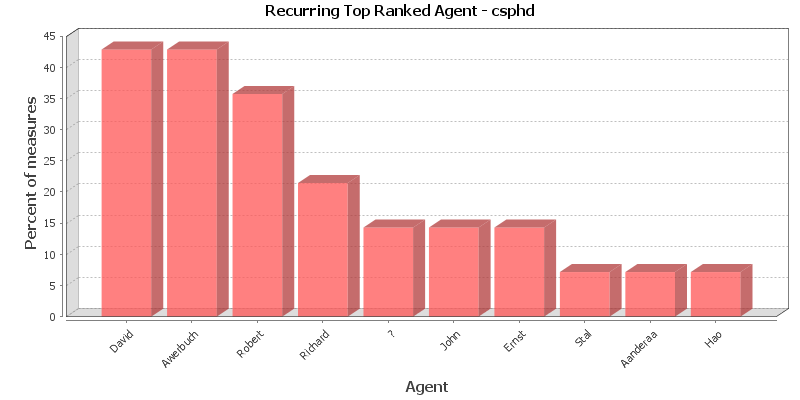
Key Nodes
This chart shows the Agent that is repeatedly top-ranked in the measures listed below. The value shown is the percentage of measures for which the Agent was ranked in the top three.
Total degree centrality
The Total Degree Centrality of a node is the normalized sum of its row and column degrees. Individuals or organizations who are "in the know" are those who are linked to many others and so, by virtue of their position have access to the ideas, thoughts, beliefs of many others. Individuals who are "in the know" are identified by degree centrality in the relevant social network. Those who are ranked high on this metrics have more connections to others in the same network. The scientific name of this measure is total degree centrality and it is calculated on the agent by agent matrices.
Input network: test (size: 1390, density: 0.000897079)
Rank Agent Value Unscaled Context* 1 Awerbuch 0.017 46.000 19.504 2 David 0.013 37.000 15.469 3 John 0.013 35.000 14.573 4 Robert 0.012 33.000 13.676 5 Ernst 0.010 27.000 10.987 6 ? 0.009 26.000 10.538 7 Richard 0.009 26.000 10.538 8 Seymour 0.009 25.000 10.090 9 Michael 0.009 25.000 10.090 10 Peter 0.009 25.000 10.090 * Number of standard deviations from the mean of a random network of the same size and density
Mean: 0.001 Mean in random network: 0.001 Std.dev: 0.001 Std.dev in random network: 0.001 In-degree centrality
The In Degree Centrality of a node is its normalized in-degree. For any node, e.g. an individual or a resource, the in-links are the connections that the node of interest receives from other nodes. For example, imagine an agent by knowledge matrix then the number of in-links a piece of knowledge has is the number of agents that are connected to. The scientific name of this measure is in-degree and it is calculated on the agent by agent matrices.
Input network(s): test
Rank Agent Value Unscaled 1 John 0.014 20.000 2 ? 0.013 18.000 3 David 0.012 16.000 4 Peter 0.010 14.000 5 Michael 0.009 13.000 6 Martin 0.009 12.000 7 J. 0.009 12.000 8 Paul 0.009 12.000 9 Richard 0.008 11.000 10 Robert 0.007 10.000 Out-degree centrality
For any node, e.g. an individual or a resource, the out-links are the connections that the node of interest sends to other nodes. For example, imagine an agent by knowledge matrix then the number of out-links an agent would have is the number of pieces of knowledge it is connected to. The scientific name of this measure is out-degree and it is calculated on the agent by agent matrices. Individuals or organizations who are high in most knowledge have more expertise or are associated with more types of knowledge than are others. If no sub-network connecting agents to knowledge exists, then this measure will not be calculated. The scientific name of this measure is out degree centrality and it is calculated on agent by knowledge matrices. Individuals or organizations who are high in "most resources" have more resources or are associated with more types of resources than are others. If no sub-network connecting agents to resources exists, then this measure will not be calculated. The scientific name of this measure is out degree centrality and it is calculated on agent by resource matrices.
Input network(s): test
Rank Agent Value Unscaled 1 Awerbuch 0.032 45.000 2 Ernst 0.018 25.000 3 Seymour 0.017 23.000 4 Robert 0.017 23.000 5 David 0.015 21.000 6 Karl 0.013 18.000 7 Richter 0.012 17.000 8 Kleene 0.012 16.000 9 Richard 0.011 15.000 10 John 0.011 15.000 Eigenvector centrality
Calculates the principal eigenvector of the network. A node is central to the extent that its neighbors are central. Leaders of strong cliques are individuals who or organizations who are collected to others that are themselves highly connected to each other. In other words, if you have a clique then the individual most connected to others in the clique and other cliques, is the leader of the clique. Individuals or organizations who are connected to many otherwise isolated individuals or organizations will have a much lower score in this measure then those that are connected to groups that have many connections themselves. The scientific name of this measure is eigenvector centrality and it is calculated on agent by agent matrices.
Input network: test (size: 1390, density: 0.000897079)
Rank Agent Value Unscaled Context* 1 Awerbuch 0.521 0.369 0.067 2 Robert 0.442 0.312 -0.520 3 David 0.396 0.280 -0.858 4 Richard 0.381 0.269 -0.974 5 John 0.293 0.207 -1.618 6 Martin 0.220 0.155 -2.161 7 ? 0.212 0.150 -2.219 8 Paul 0.208 0.147 -2.249 9 James 0.193 0.136 -2.360 10 J. 0.174 0.123 -2.496 * Number of standard deviations from the mean of a random network of the same size and density
Mean: 0.016 Mean in random network: 0.512 Std.dev: 0.034 Std.dev in random network: 0.135 Eigenvector centrality per component
Calculates the principal eigenvector of the network. A node is central to the extent that its neighbors are central. Each component is extracted as a separate network, Eigenvector Centrality is computed on it and scaled according to the component size. The scores are then combined into a single result vector.
Input network(s): test
Rank Agent Value 1 Awerbuch 0.336 2 Robert 0.285 3 David 0.255 4 Richard 0.245 5 John 0.189 6 Martin 0.142 7 ? 0.137 8 Paul 0.134 9 James 0.124 10 J. 0.112 Closeness centrality
The average closeness of a node to the other nodes in a network (also called out-closeness). Loosely, Closeness is the inverse of the average distance in the network from the node to all other nodes.
Input network: test (size: 1390, density: 0.000897079)
Rank Agent Value Unscaled Context* 1 Huynh 0.002 0.000 -2.866 2 Borodin 0.002 0.000 -2.866 3 Kreisel 0.002 0.000 -2.866 4 Chvatal 0.002 0.000 -2.866 5 Kleene 0.002 0.000 -2.866 6 Edelsbrunner 0.002 0.000 -2.866 7 Herbert 0.002 0.000 -2.866 8 Blair 0.002 0.000 -2.866 9 Aanderaa 0.002 0.000 -2.867 10 L.W. 0.002 0.000 -2.867 * Number of standard deviations from the mean of a random network of the same size and density
Mean: 0.001 Mean in random network: 0.202 Std.dev: 0.000 Std.dev in random network: 0.070 In-Closeness centrality
The average closeness of a node from the other nodes in a network. Loosely, Closeness is the inverse of the average distance in the network to the node and from all other nodes.
Input network(s): test
Rank Agent Value Unscaled 1 Andrew 0.001 0.000 2 Greenberg 0.001 0.000 3 Warren 0.001 0.000 4 Devore 0.001 0.000 5 Sam 0.001 0.000 6 Mazurkiewicz 0.001 0.000 7 W. 0.001 0.000 8 Toueg 0.001 0.000 9 Thomas 0.001 0.000 10 Ronald 0.001 0.000 Betweenness centrality
The Betweenness Centrality of node v in a network is defined as: across all node pairs that have a shortest path containing v, the percentage that pass through v. Individuals or organizations that are potentially influential are positioned to broker connections between groups and to bring to bear the influence of one group on another or serve as a gatekeeper between groups. This agent occurs on many of the shortest paths between other agents. The scientific name of this measure is betweenness centrality and it is calculated on agent by agent matrices.
Input network: test (size: 1390, density: 0.000897079)
Rank Agent Value Unscaled Context* 1 Martin 0.040 76348.484 0.055 2 ? 0.035 67149.586 0.048 3 Richard 0.033 64155.473 0.046 4 John 0.029 55485.988 0.039 5 David 0.028 54656.918 0.039 6 Robert 0.028 53759.875 0.038 7 Peter 0.025 47677.039 0.033 8 E. 0.024 46623.703 0.032 9 Brown 0.024 45860.438 0.032 10 Michael 0.024 45729.328 0.032 * Number of standard deviations from the mean of a random network of the same size and density
Mean: 0.001 Mean in random network: 0.002 Std.dev: 0.003 Std.dev in random network: 0.690 Hub centrality
A node is hub-central to the extent that its out-links are to nodes that have many in-links. Individuals or organizations that act as hubs are sending information to a wide range of others each of whom has many others reporting to them. Technically, an agent is hub-central if its out-links are to agents that have many other agents sending links to them. The scientific name of this measure is hub centrality and it is calculated on agent by agent matrices.
Input network(s): test
Rank Agent Value 1 Awerbuch 1.341 2 Robert 0.164 3 Nancy 0.112 4 Corneil 0.112 5 Dobkin 0.094 6 M.L. 0.088 7 Richard 0.087 8 James 0.082 9 Aarvik 0.073 10 Keith 0.070 Authority centrality
A node is authority-central to the extent that its in-links are from nodes that have many out-links. Individuals or organizations that act as authorities are receiving information from a wide range of others each of whom sends information to a large number of others. Technically, an agent is authority-central if its in-links are from agents that have are sending links to many others. The scientific name of this measure is authority centrality and it is calculated on agent by agent matrices.
Input network(s): test
Rank Agent Value 1 David 0.342 2 Richard 0.282 3 A. 0.264 4 Robert 0.263 5 Jan 0.225 6 James 0.221 7 Harry 0.221 8 Bruce 0.218 9 Chaudhuri 0.211 10 Schmidt 0.200 Information centrality
Calculate the Stephenson and Zelen information centrality measure for each node.
Input network(s): test
Rank Agent Value Unscaled 1 Awerbuch 0.004 3.152 2 Ernst 0.004 2.985 3 Robert 0.004 2.955 4 Seymour 0.004 2.954 5 David 0.004 2.904 6 Karl 0.004 2.853 7 Richter 0.004 2.826 8 Kleene 0.004 2.797 9 Richard 0.004 2.766 10 John 0.004 2.766 Clique membership count
The number of distinct cliques to which each node belongs. Individuals or organizations who are high in number of cliques are those that belong to a large number of distinct cliques. A clique is defined as a group of three or more actors that have many connections to each other and relatively fewer connections to those in other groups. The scientific name of this measure is clique count and it is calculated on the agent by agent matrices.
Input network(s): test
Rank Agent Value 1 Robert 11.000 2 David 7.000 3 Richard 6.000 4 Michael 6.000 5 Peter 5.000 6 Awerbuch 5.000 7 Karl 4.000 8 John 4.000 9 Paul 4.000 10 ? 3.000 Simmelian ties
The normalized number of Simmelian ties of each node.
Input network(s): test
Rank Agent Value Unscaled 1 All nodes have this value 0.000 Clustering coefficient
Measures the degree of clustering in a network by averaging the clustering coefficient of each node, which is defined as the density of the node's ego network.
Input network(s): test
Rank Agent Value 1 Ronald 0.500 2 Carver 0.500 3 Bruce 0.500 4 Nash-Williams 0.500 5 Condon 0.500 6 Daley 0.500 7 Dietz 0.500 8 Garner 0.500 9 Goyal 0.500 10 Udai 0.500
Key Nodes Table
This shows the top scoring nodes side-by-side for selected measures.
Rank Betweenness centrality Closeness centrality Eigenvector centrality Eigenvector centrality per component In-degree centrality In-Closeness centrality Out-degree centrality Total degree centrality 1 Martin Huynh Awerbuch Awerbuch John Andrew Awerbuch Awerbuch 2 ? Borodin Robert Robert ? Greenberg Ernst David 3 Richard Kreisel David David David Warren Seymour John 4 John Chvatal Richard Richard Peter Devore Robert Robert 5 David Kleene John John Michael Sam David Ernst 6 Robert Edelsbrunner Martin Martin Martin Mazurkiewicz Karl ? 7 Peter Herbert ? ? J. W. Richter Richard 8 E. Blair Paul Paul Paul Toueg Kleene Seymour 9 Brown Aanderaa James James Richard Thomas Richard Michael 10 Michael L.W. J. J. Robert Ronald John Peter