Calculates common social network measures on each selected input network.
Network test
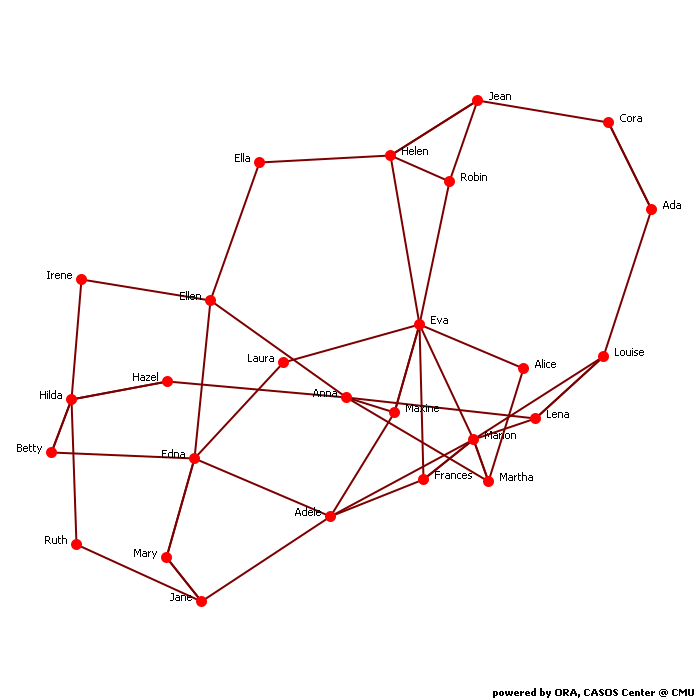
Network Level Measures
Measure Value Row count 26.000 Column count 26.000 Link count 52.000 Density 0.080 Components of 1 node (isolates) 0 Components of 2 nodes (dyadic isolates) 0 Components of 3 or more nodes 1 Reciprocity 0.238 Characteristic path length 4.052 Clustering coefficient 0.069 Network levels (diameter) 11.000 Network fragmentation 0.000 Krackhardt connectedness 1.000 Krackhardt efficiency 0.943 Krackhardt hierarchy 0.808 Krackhardt upperboundedness 0.767 Degree centralization 0.076 Betweenness centralization 0.096 Closeness centralization 0.029 Eigenvector centralization 0.448 Reciprocal (symmetric)? No (23% of the links are reciprocal)
Node Level Measures
Measure Min Max Avg Stddev Total degree centrality 0.030 0.130 0.060 0.025 Total degree centrality [Unscaled] 3.000 13.000 6.000 2.481 In-degree centrality 0.000 0.200 0.060 0.050 In-degree centrality [Unscaled] 0.000 10.000 3.000 2.481 Out-degree centrality 0.060 0.060 0.060 0.000 Out-degree centrality [Unscaled] 3.000 3.000 3.000 0.000 Eigenvector centrality 0.046 0.644 0.230 0.155 Eigenvector centrality [Unscaled] 0.033 0.455 0.163 0.110 Eigenvector centrality per component 0.033 0.455 0.163 0.110 Closeness centrality 0.027 0.047 0.033 0.006 Closeness centrality [Unscaled] 0.001 0.002 0.001 0.000 In-Closeness centrality 0.019 0.284 0.099 0.108 In-Closeness centrality [Unscaled] 0.001 0.011 0.004 0.004 Betweenness centrality 0.000 0.127 0.035 0.037 Betweenness centrality [Unscaled] 0.000 76.500 21.192 22.255 Hub centrality 0.000 0.651 0.187 0.204 Authority centrality 0.000 1.260 0.125 0.248 Information centrality 0.029 0.048 0.038 0.005 Information centrality [Unscaled] 0.948 1.588 1.274 0.150 Clique membership count 0.000 3.000 0.577 0.885 Simmelian ties 0.000 0.000 0.000 0.000 Simmelian ties [Unscaled] 0.000 0.000 0.000 0.000 Clustering coefficient 0.000 0.500 0.069 0.121
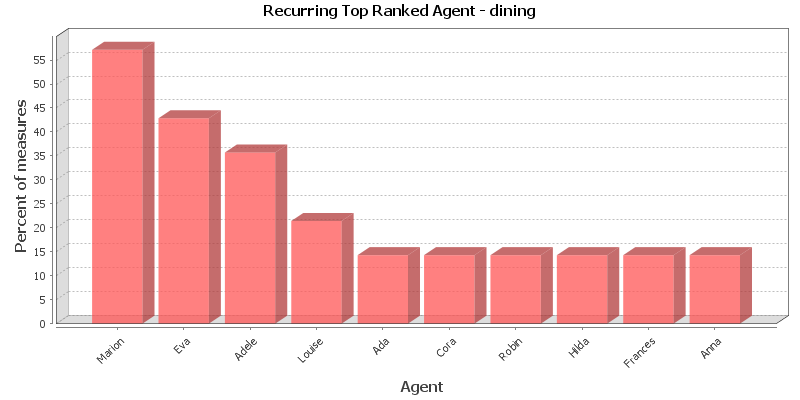
Key Nodes
This chart shows the Agent that is repeatedly top-ranked in the measures listed below. The value shown is the percentage of measures for which the Agent was ranked in the top three.
Total degree centrality
The Total Degree Centrality of a node is the normalized sum of its row and column degrees. Individuals or organizations who are "in the know" are those who are linked to many others and so, by virtue of their position have access to the ideas, thoughts, beliefs of many others. Individuals who are "in the know" are identified by degree centrality in the relevant social network. Those who are ranked high on this metrics have more connections to others in the same network. The scientific name of this measure is total degree centrality and it is calculated on the agent by agent matrices.
Input network: test (size: 26, density: 0.08)
Rank Agent Value Unscaled Context* 1 Marion 0.130 13.000 0.940 2 Eva 0.110 11.000 0.564 3 Hilda 0.090 9.000 0.188 4 Edna 0.090 9.000 0.188 5 Helen 0.080 8.000 0.000 6 Louise 0.070 7.000 -0.188 7 Lena 0.070 7.000 -0.188 8 Adele 0.070 7.000 -0.188 9 Anna 0.070 7.000 -0.188 10 Jean 0.060 6.000 -0.376 * Number of standard deviations from the mean of a random network of the same size and density
Mean: 0.060 Mean in random network: 0.080 Std.dev: 0.025 Std.dev in random network: 0.053 In-degree centrality
The In Degree Centrality of a node is its normalized in-degree. For any node, e.g. an individual or a resource, the in-links are the connections that the node of interest receives from other nodes. For example, imagine an agent by knowledge matrix then the number of in-links a piece of knowledge has is the number of agents that are connected to. The scientific name of this measure is in-degree and it is calculated on the agent by agent matrices.
Input network(s): test
Rank Agent Value Unscaled 1 Marion 0.200 10.000 2 Eva 0.160 8.000 3 Hilda 0.120 6.000 4 Edna 0.120 6.000 5 Helen 0.100 5.000 6 Louise 0.080 4.000 7 Lena 0.080 4.000 8 Adele 0.080 4.000 9 Anna 0.080 4.000 10 Jean 0.060 3.000 Out-degree centrality
For any node, e.g. an individual or a resource, the out-links are the connections that the node of interest sends to other nodes. For example, imagine an agent by knowledge matrix then the number of out-links an agent would have is the number of pieces of knowledge it is connected to. The scientific name of this measure is out-degree and it is calculated on the agent by agent matrices. Individuals or organizations who are high in most knowledge have more expertise or are associated with more types of knowledge than are others. If no sub-network connecting agents to knowledge exists, then this measure will not be calculated. The scientific name of this measure is out degree centrality and it is calculated on agent by knowledge matrices. Individuals or organizations who are high in "most resources" have more resources or are associated with more types of resources than are others. If no sub-network connecting agents to resources exists, then this measure will not be calculated. The scientific name of this measure is out degree centrality and it is calculated on agent by resource matrices.
Input network(s): test
Rank Agent Value Unscaled 1 All nodes have this value 0.060 Eigenvector centrality
Calculates the principal eigenvector of the network. A node is central to the extent that its neighbors are central. Leaders of strong cliques are individuals who or organizations who are collected to others that are themselves highly connected to each other. In other words, if you have a clique then the individual most connected to others in the clique and other cliques, is the leader of the clique. Individuals or organizations who are connected to many otherwise isolated individuals or organizations will have a much lower score in this measure then those that are connected to groups that have many connections themselves. The scientific name of this measure is eigenvector centrality and it is calculated on agent by agent matrices.
Input network: test (size: 26, density: 0.08)
Rank Agent Value Unscaled Context* 1 Marion 0.644 0.455 1.029 2 Eva 0.600 0.424 0.883 3 Adele 0.435 0.308 0.329 4 Frances 0.380 0.268 0.141 5 Helen 0.361 0.255 0.079 6 Martha 0.318 0.225 -0.067 7 Maxine 0.309 0.218 -0.097 8 Edna 0.292 0.207 -0.153 9 Robin 0.272 0.192 -0.222 10 Lena 0.259 0.183 -0.265 * Number of standard deviations from the mean of a random network of the same size and density
Mean: 0.230 Mean in random network: 0.338 Std.dev: 0.155 Std.dev in random network: 0.298 Eigenvector centrality per component
Calculates the principal eigenvector of the network. A node is central to the extent that its neighbors are central. Each component is extracted as a separate network, Eigenvector Centrality is computed on it and scaled according to the component size. The scores are then combined into a single result vector.
Input network(s): test
Rank Agent Value 1 Marion 0.455 2 Eva 0.424 3 Adele 0.308 4 Frances 0.268 5 Helen 0.255 6 Martha 0.225 7 Maxine 0.218 8 Edna 0.207 9 Robin 0.192 10 Lena 0.183 Closeness centrality
The average closeness of a node to the other nodes in a network (also called out-closeness). Loosely, Closeness is the inverse of the average distance in the network from the node to all other nodes.
Input network: test (size: 26, density: 0.08)
Rank Agent Value Unscaled Context* 1 Ella 0.047 0.002 -3.916 2 Irene 0.046 0.002 -3.928 3 Ruth 0.043 0.002 -4.005 4 Hazel 0.040 0.002 -4.068 5 Hilda 0.039 0.002 -4.079 6 Betty 0.039 0.002 -4.082 7 Ada 0.037 0.001 -4.131 8 Cora 0.037 0.001 -4.134 9 Ellen 0.035 0.001 -4.172 10 Laura 0.035 0.001 -4.179 * Number of standard deviations from the mean of a random network of the same size and density
Mean: 0.033 Mean in random network: 0.233 Std.dev: 0.006 Std.dev in random network: 0.048 In-Closeness centrality
The average closeness of a node from the other nodes in a network. Loosely, Closeness is the inverse of the average distance in the network to the node and from all other nodes.
Input network(s): test
Rank Agent Value Unscaled 1 Marion 0.284 0.011 2 Maxine 0.284 0.011 3 Eva 0.284 0.011 4 Adele 0.284 0.011 5 Frances 0.260 0.010 6 Anna 0.238 0.010 7 Martha 0.229 0.009 8 Lena 0.175 0.007 9 Louise 0.137 0.005 10 Edna 0.031 0.001 Betweenness centrality
The Betweenness Centrality of node v in a network is defined as: across all node pairs that have a shortest path containing v, the percentage that pass through v. Individuals or organizations that are potentially influential are positioned to broker connections between groups and to bring to bear the influence of one group on another or serve as a gatekeeper between groups. This agent occurs on many of the shortest paths between other agents. The scientific name of this measure is betweenness centrality and it is calculated on agent by agent matrices.
Input network: test (size: 26, density: 0.08)
Rank Agent Value Unscaled Context* 1 Anna 0.127 76.500 0.292 2 Marion 0.124 74.333 0.269 3 Adele 0.095 57.000 0.083 4 Martha 0.087 52.500 0.035 5 Eva 0.077 46.000 -0.035 6 Maxine 0.056 33.500 -0.169 7 Lena 0.053 32.000 -0.185 8 Edna 0.051 30.500 -0.201 9 Ellen 0.032 19.000 -0.325 10 Hilda 0.030 18.000 -0.335 * Number of standard deviations from the mean of a random network of the same size and density
Mean: 0.035 Mean in random network: 0.082 Std.dev: 0.037 Std.dev in random network: 0.155 Hub centrality
A node is hub-central to the extent that its out-links are to nodes that have many in-links. Individuals or organizations that act as hubs are sending information to a wide range of others each of whom has many others reporting to them. Technically, an agent is hub-central if its out-links are to agents that have many other agents sending links to them. The scientific name of this measure is hub centrality and it is calculated on agent by agent matrices.
Input network(s): test
Rank Agent Value 1 Frances 0.651 2 Martha 0.607 3 Adele 0.600 4 Eva 0.597 5 Louise 0.384 6 Lena 0.374 7 Maxine 0.195 8 Helen 0.193 9 Laura 0.153 10 Anna 0.140 Authority centrality
A node is authority-central to the extent that its in-links are from nodes that have many out-links. Individuals or organizations that act as authorities are receiving information from a wide range of others each of whom sends information to a large number of others. Technically, an agent is authority-central if its in-links are from agents that have are sending links to many others. The scientific name of this measure is authority centrality and it is calculated on agent by agent matrices.
Input network(s): test
Rank Agent Value 1 Marion 1.260 2 Eva 0.407 3 Lena 0.233 4 Louise 0.210 5 Anna 0.208 6 Frances 0.176 7 Maxine 0.164 8 Edna 0.141 9 Hilda 0.078 10 Helen 0.078 Information centrality
Calculate the Stephenson and Zelen information centrality measure for each node.
Input network(s): test
Rank Agent Value Unscaled 1 Adele 0.048 1.588 2 Anna 0.045 1.493 3 Ellen 0.043 1.420 4 Laura 0.042 1.394 5 Alice 0.042 1.394 6 Ruth 0.042 1.394 7 Ella 0.042 1.394 8 Irene 0.042 1.394 9 Edna 0.041 1.366 10 Robin 0.040 1.330 Clique membership count
The number of distinct cliques to which each node belongs. Individuals or organizations who are high in number of cliques are those that belong to a large number of distinct cliques. A clique is defined as a group of three or more actors that have many connections to each other and relatively fewer connections to those in other groups. The scientific name of this measure is clique count and it is calculated on the agent by agent matrices.
Input network(s): test
Rank Agent Value 1 Marion 3.000 2 Helen 2.000 3 Robin 2.000 4 Frances 2.000 5 Eva 2.000 6 Louise 1.000 7 Jean 1.000 8 Lena 1.000 9 Adele 1.000 Simmelian ties
The normalized number of Simmelian ties of each node.
Input network(s): test
Rank Agent Value Unscaled 1 All nodes have this value 0.000 Clustering coefficient
Measures the degree of clustering in a network by averaging the clustering coefficient of each node, which is defined as the density of the node's ego network.
Input network(s): test
Rank Agent Value 1 Robin 0.500 2 Frances 0.333 3 Louise 0.167 4 Jean 0.167 5 Helen 0.167 6 Lena 0.167 7 Marion 0.133 8 Adele 0.100 9 Eva 0.071
Key Nodes Table
This shows the top scoring nodes side-by-side for selected measures.
Rank Betweenness centrality Closeness centrality Eigenvector centrality Eigenvector centrality per component In-degree centrality In-Closeness centrality Out-degree centrality Total degree centrality 1 Anna Ella Marion Marion Marion Marion Ada Marion 2 Marion Irene Eva Eva Eva Maxine Cora Eva 3 Adele Ruth Adele Adele Hilda Eva Louise Hilda 4 Martha Hazel Frances Frances Edna Adele Jean Edna 5 Eva Hilda Helen Helen Helen Frances Helen Helen 6 Maxine Betty Martha Martha Louise Anna Martha Louise 7 Lena Ada Maxine Maxine Lena Martha Alice Lena 8 Edna Cora Edna Edna Adele Lena Robin Adele 9 Ellen Ellen Robin Robin Anna Louise Marion Anna 10 Hilda Laura Lena Lena Jean Edna Maxine Jean