Calculates common social network measures on each selected input network.
Network drugnet
Network Level Measures
Measure Value Row count 293.000 Column count 293.000 Link count 337.000 Density 0.004 Components of 1 node (isolates) 81 Components of 2 nodes (dyadic isolates) 5 Components of 3 or more nodes 4 Reciprocity 0.187 Characteristic path length 7.339 Clustering coefficient 0.059 Network levels (diameter) 22.000 Network fragmentation 0.567 Krackhardt connectedness 0.433 Krackhardt efficiency 0.996 Krackhardt hierarchy 0.896 Krackhardt upperboundedness 0.352 Degree centralization 0.022 Betweenness centralization 0.030 Closeness centralization 0.002 Eigenvector centralization 0.659 Reciprocal (symmetric)? No (18% of the links are reciprocal)
Node Level Measures
Measure Min Max Avg Stddev Total degree centrality 0.000 0.026 0.004 0.004 Total degree centrality [Unscaled] 0.000 15.000 2.300 2.404 In-degree centrality 0.000 0.034 0.004 0.006 In-degree centrality [Unscaled] 0.000 10.000 1.150 1.680 Out-degree centrality 0.000 0.017 0.004 0.004 Out-degree centrality [Unscaled] 0.000 5.000 1.150 1.191 Eigenvector centrality 0.000 0.685 0.031 0.077 Eigenvector centrality [Unscaled] 0.000 0.485 0.022 0.054 Eigenvector centrality per component 0.000 0.319 0.015 0.036 Closeness centrality 0.003 0.005 0.004 0.000 Closeness centrality [Unscaled] 0.000 0.000 0.000 0.000 In-Closeness centrality 0.003 0.006 0.004 0.001 In-Closeness centrality [Unscaled] 0.000 0.000 0.000 0.000 Betweenness centrality 0.000 0.031 0.001 0.005 Betweenness centrality [Unscaled] 0.000 2625.833 125.812 390.249 Hub centrality 0.000 0.602 0.026 0.078 Authority centrality 0.000 0.879 0.018 0.081 Information centrality -0.000 0.006 0.003 0.003 Information centrality [Unscaled] -0.000 0.000 -0.000 0.000 Clique membership count 0.000 6.000 0.331 0.759 Simmelian ties 0.000 0.007 0.000 0.001 Simmelian ties [Unscaled] 0.000 2.000 0.041 0.283 Clustering coefficient 0.000 1.000 0.059 0.153
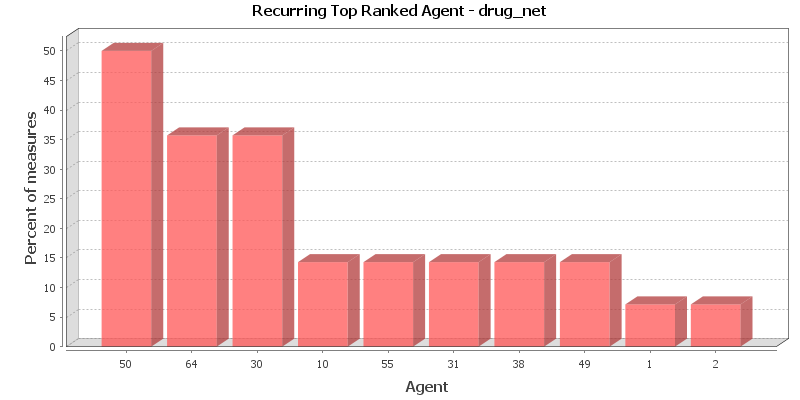
Key Nodes
This chart shows the Agent that is repeatedly top-ranked in the measures listed below. The value shown is the percentage of measures for which the Agent was ranked in the top three.
Total degree centrality
The Total Degree Centrality of a node is the normalized sum of its row and column degrees. Individuals or organizations who are "in the know" are those who are linked to many others and so, by virtue of their position have access to the ideas, thoughts, beliefs of many others. Individuals who are "in the know" are identified by degree centrality in the relevant social network. Those who are ranked high on this metrics have more connections to others in the same network. The scientific name of this measure is total degree centrality and it is calculated on the agent by agent matrices.
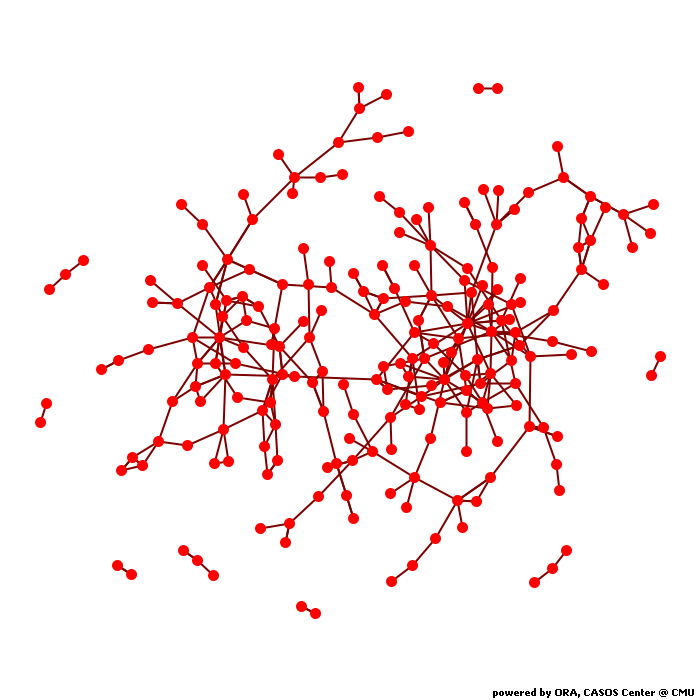
Input network: drugnet (size: 293, density: 0.00393894)
Rank Agent Value Unscaled Context* 1 50 0.026 15.000 5.943 2 38 0.022 13.000 5.007 3 64 0.021 12.000 4.539 4 30 0.019 11.000 4.071 5 31 0.015 9.000 3.135 6 55 0.014 8.000 2.667 7 22 0.014 8.000 2.667 8 173 0.014 8.000 2.667 9 150 0.014 8.000 2.667 10 65 0.012 7.000 2.199 * Number of standard deviations from the mean of a random network of the same size and density
Mean: 0.004 Mean in random network: 0.004 Std.dev: 0.004 Std.dev in random network: 0.004 In-degree centrality
The In Degree Centrality of a node is its normalized in-degree. For any node, e.g. an individual or a resource, the in-links are the connections that the node of interest receives from other nodes. For example, imagine an agent by knowledge matrix then the number of in-links a piece of knowledge has is the number of agents that are connected to. The scientific name of this measure is in-degree and it is calculated on the agent by agent matrices.
Input network(s): drugnet
Rank Agent Value Unscaled 1 30 0.034 10.000 2 38 0.034 10.000 3 50 0.034 10.000 4 64 0.027 8.000 5 65 0.024 7.000 6 165 0.017 5.000 7 22 0.017 5.000 8 124 0.017 5.000 9 87 0.017 5.000 10 75 0.017 5.000 Out-degree centrality
For any node, e.g. an individual or a resource, the out-links are the connections that the node of interest sends to other nodes. For example, imagine an agent by knowledge matrix then the number of out-links an agent would have is the number of pieces of knowledge it is connected to. The scientific name of this measure is out-degree and it is calculated on the agent by agent matrices. Individuals or organizations who are high in most knowledge have more expertise or are associated with more types of knowledge than are others. If no sub-network connecting agents to knowledge exists, then this measure will not be calculated. The scientific name of this measure is out degree centrality and it is calculated on agent by knowledge matrices. Individuals or organizations who are high in "most resources" have more resources or are associated with more types of resources than are others. If no sub-network connecting agents to resources exists, then this measure will not be calculated. The scientific name of this measure is out degree centrality and it is calculated on agent by resource matrices.
Input network(s): drugnet
Rank Agent Value Unscaled 1 55 0.017 5.000 2 31 0.017 5.000 3 49 0.017 5.000 4 50 0.017 5.000 5 58 0.017 5.000 6 83 0.017 5.000 7 216 0.014 4.000 8 64 0.014 4.000 9 66 0.014 4.000 10 148 0.014 4.000 Eigenvector centrality
Calculates the principal eigenvector of the network. A node is central to the extent that its neighbors are central. Leaders of strong cliques are individuals who or organizations who are collected to others that are themselves highly connected to each other. In other words, if you have a clique then the individual most connected to others in the clique and other cliques, is the leader of the clique. Individuals or organizations who are connected to many otherwise isolated individuals or organizations will have a much lower score in this measure then those that are connected to groups that have many connections themselves. The scientific name of this measure is eigenvector centrality and it is calculated on agent by agent matrices.
Input network: drugnet (size: 293, density: 0.00393894)
Rank Agent Value Unscaled Context* 1 50 0.685 0.485 2.360 2 30 0.463 0.327 1.102 3 64 0.436 0.308 0.951 4 58 0.352 0.249 0.477 5 55 0.265 0.187 -0.017 6 190 0.252 0.178 -0.087 7 20 0.235 0.166 -0.185 8 67 0.228 0.161 -0.226 9 210 0.218 0.154 -0.278 10 70 0.213 0.151 -0.307 * Number of standard deviations from the mean of a random network of the same size and density
Mean: 0.031 Mean in random network: 0.267 Std.dev: 0.077 Std.dev in random network: 0.177 Eigenvector centrality per component
Calculates the principal eigenvector of the network. A node is central to the extent that its neighbors are central. Each component is extracted as a separate network, Eigenvector Centrality is computed on it and scaled according to the component size. The scores are then combined into a single result vector.
Input network(s): drugnet
Rank Agent Value 1 50 0.319 2 30 0.216 3 64 0.203 4 58 0.164 5 55 0.123 6 190 0.117 7 20 0.109 8 67 0.106 9 210 0.102 10 70 0.099 Closeness centrality
The average closeness of a node to the other nodes in a network (also called out-closeness). Loosely, Closeness is the inverse of the average distance in the network from the node to all other nodes.
Input network: drugnet (size: 293, density: 0.00393894)
Rank Agent Value Unscaled Context* 1 216 0.005 0.000 -0.899 2 13 0.005 0.000 -0.899 3 194 0.005 0.000 -0.899 4 169 0.005 0.000 -0.901 5 192 0.005 0.000 -0.901 6 151 0.005 0.000 -0.902 7 184 0.005 0.000 -0.903 8 150 0.005 0.000 -0.906 9 167 0.005 0.000 -0.906 10 171 0.005 0.000 -0.906 * Number of standard deviations from the mean of a random network of the same size and density
Mean: 0.004 Mean in random network: 0.017 Std.dev: 0.000 Std.dev in random network: 0.014 In-Closeness centrality
The average closeness of a node from the other nodes in a network. Loosely, Closeness is the inverse of the average distance in the network to the node and from all other nodes.
Input network(s): drugnet
Rank Agent Value Unscaled 1 29 0.006 0.000 2 28 0.006 0.000 3 10 0.005 0.000 4 2 0.005 0.000 5 1 0.005 0.000 6 258 0.005 0.000 7 65 0.005 0.000 8 165 0.005 0.000 9 255 0.005 0.000 10 115 0.005 0.000 Betweenness centrality
The Betweenness Centrality of node v in a network is defined as: across all node pairs that have a shortest path containing v, the percentage that pass through v. Individuals or organizations that are potentially influential are positioned to broker connections between groups and to bring to bear the influence of one group on another or serve as a gatekeeper between groups. This agent occurs on many of the shortest paths between other agents. The scientific name of this measure is betweenness centrality and it is calculated on agent by agent matrices.
Input network: drugnet (size: 293, density: 0.00393894)
Rank Agent Value Unscaled Context* 1 50 0.031 2625.833 0.139 2 31 0.024 2047.000 0.080 3 55 0.023 1972.667 0.072 4 220 0.023 1914.000 0.066 5 68 0.021 1826.500 0.057 6 14 0.021 1786.000 0.053 7 52 0.021 1765.000 0.051 8 124 0.021 1753.000 0.050 9 24 0.020 1718.000 0.046 10 209 0.019 1639.000 0.038 * Number of standard deviations from the mean of a random network of the same size and density
Mean: 0.001 Mean in random network: 0.015 Std.dev: 0.005 Std.dev in random network: 0.114 Hub centrality
A node is hub-central to the extent that its out-links are to nodes that have many in-links. Individuals or organizations that act as hubs are sending information to a wide range of others each of whom has many others reporting to them. Technically, an agent is hub-central if its out-links are to agents that have many other agents sending links to them. The scientific name of this measure is hub centrality and it is calculated on agent by agent matrices.
Input network(s): drugnet
Rank Agent Value 1 58 0.602 2 49 0.424 3 190 0.424 4 210 0.424 5 50 0.375 6 70 0.302 7 93 0.289 8 67 0.259 9 64 0.258 10 134 0.243 Authority centrality
A node is authority-central to the extent that its in-links are from nodes that have many out-links. Individuals or organizations that act as authorities are receiving information from a wide range of others each of whom sends information to a large number of others. Technically, an agent is authority-central if its in-links are from agents that have are sending links to many others. The scientific name of this measure is authority centrality and it is calculated on agent by agent matrices.
Input network(s): drugnet
Rank Agent Value 1 30 0.879 2 50 0.791 3 64 0.398 4 20 0.263 5 104 0.221 6 182 0.219 7 165 0.196 8 107 0.175 9 127 0.167 10 117 0.150 Information centrality
Calculate the Stephenson and Zelen information centrality measure for each node.
Input network(s): drugnet
Rank Agent Value 1 78 0.006 2 90 0.006 3 104 0.006 4 217 0.006 5 91 0.006 6 102 0.006 7 75 0.006 8 223 0.006 9 88 0.006 10 137 0.006 Clique membership count
The number of distinct cliques to which each node belongs. Individuals or organizations who are high in number of cliques are those that belong to a large number of distinct cliques. A clique is defined as a group of three or more actors that have many connections to each other and relatively fewer connections to those in other groups. The scientific name of this measure is clique count and it is calculated on the agent by agent matrices.
Input network(s): drugnet
Rank Agent Value 1 50 6.000 2 64 4.000 3 30 4.000 4 58 4.000 5 212 3.000 6 105 3.000 7 1 2.000 8 2 2.000 9 104 2.000 10 20 2.000 Simmelian ties
The normalized number of Simmelian ties of each node.
Input network(s): drugnet
Rank Agent Value Unscaled 1 1 0.007 2.000 2 2 0.007 2.000 3 10 0.007 2.000 4 171 0.007 2.000 5 173 0.007 2.000 6 150 0.007 2.000 Clustering coefficient
Measures the degree of clustering in a network by averaging the clustering coefficient of each node, which is defined as the density of the node's ego network.
Input network(s): drugnet
Rank Agent Value 1 217 1.000 2 123 1.000 3 140 1.000 4 1 0.500 5 17 0.500 6 70 0.500 7 77 0.500 8 131 0.500 9 169 0.500 10 194 0.500
Key Nodes Table
This shows the top scoring nodes side-by-side for selected measures.
Rank Betweenness centrality Closeness centrality Eigenvector centrality Eigenvector centrality per component In-degree centrality In-Closeness centrality Out-degree centrality Total degree centrality 1 50 216 50 50 30 29 55 50 2 31 13 30 30 38 28 31 38 3 55 194 64 64 50 10 49 64 4 220 169 58 58 64 2 50 30 5 68 192 55 55 65 1 58 31 6 14 151 190 190 165 258 83 55 7 52 184 20 20 22 65 216 22 8 124 150 67 67 124 165 64 173 9 24 167 210 210 87 255 66 150 10 209 171 70 70 75 115 148 65