Calculates common social network measures on each selected input network.
Network organization x organization
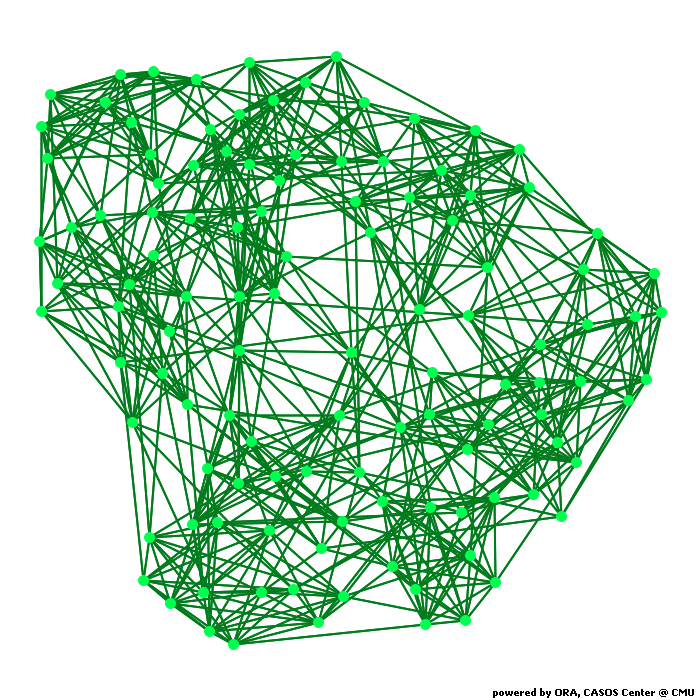
Network Level Measures
Measure Value Row count 115.000 Column count 115.000 Link count 613.000 Density 0.094 Components of 1 node (isolates) 0 Components of 2 nodes (dyadic isolates) 0 Components of 3 or more nodes 1 Reciprocity 1.000 Characteristic path length 2.508 Clustering coefficient 0.403 Network levels (diameter) 4.000 Network fragmentation 0.000 Krackhardt connectedness 1.000 Krackhardt efficiency 0.923 Krackhardt hierarchy 0.000 Krackhardt upperboundedness 1.000 Degree centralization 0.012 Betweenness centralization 0.020 Closeness centralization 0.076 Eigenvector centralization 0.052 Reciprocal (symmetric)? Yes
Node Level Measures
Measure Min Max Avg Stddev Total degree centrality 0.061 0.105 0.094 0.008 Total degree centrality [Unscaled] 7.000 12.000 10.661 0.884 In-degree centrality 0.061 0.105 0.094 0.008 In-degree centrality [Unscaled] 7.000 12.000 10.661 0.884 Out-degree centrality 0.061 0.105 0.094 0.008 Out-degree centrality [Unscaled] 7.000 12.000 10.661 0.884 Eigenvector centrality 0.068 0.181 0.130 0.023 Eigenvector centrality [Unscaled] 0.048 0.128 0.092 0.017 Eigenvector centrality per component 0.048 0.128 0.092 0.017 Closeness centrality 0.354 0.437 0.399 0.016 Closeness centrality [Unscaled] 0.003 0.004 0.004 0.000 In-Closeness centrality 0.354 0.437 0.399 0.016 In-Closeness centrality [Unscaled] 0.003 0.004 0.004 0.000 Betweenness centrality 0.003 0.034 0.013 0.006 Betweenness centrality [Unscaled] 19.337 215.986 85.965 38.504 Hub centrality 0.068 0.181 0.130 0.023 Authority centrality 0.068 0.181 0.130 0.023 Information centrality 0.007 0.009 0.009 0.000 Information centrality [Unscaled] 3.614 4.728 4.391 0.184 Clique membership count 1.000 20.000 6.617 4.454 Simmelian ties 0.035 0.105 0.079 0.012 Simmelian ties [Unscaled] 4.000 12.000 8.991 1.322 Clustering coefficient 0.111 0.667 0.403 0.104
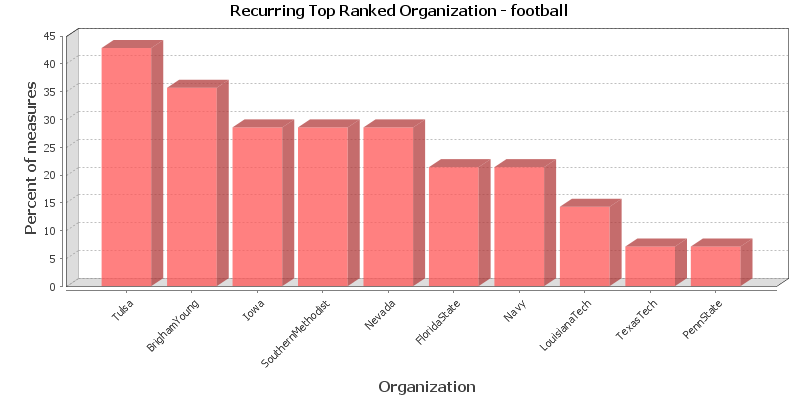
Key Nodes
This chart shows the Organization that is repeatedly top-ranked in the measures listed below. The value shown is the percentage of measures for which the Organization was ranked in the top three.
Total degree centrality
The Total Degree Centrality of a node is the normalized sum of its row and column degrees. Individuals or organizations who are "in the know" are those who are linked to many others and so, by virtue of their position have access to the ideas, thoughts, beliefs of many others. Individuals who are "in the know" are identified by degree centrality in the relevant social network. Those who are ranked high on this metrics have more connections to others in the same network. The scientific name of this measure is total degree centrality and it is calculated on the agent by agent matrices.
Input network: organization x organization (size: 115, density: 0.0935164)
Rank Organization Value Unscaled Context* 1 BrighamYoung 0.105 12.000 0.433 2 FloridaState 0.105 12.000 0.433 3 Iowa 0.105 12.000 0.433 4 KansasState 0.105 12.000 0.433 5 TexasTech 0.105 12.000 0.433 6 PennState 0.105 12.000 0.433 7 SouthernCalifornia 0.105 12.000 0.433 8 Wisconsin 0.105 12.000 0.433 9 SouthernMethodist 0.105 12.000 0.433 10 Nevada 0.105 12.000 0.433 * Number of standard deviations from the mean of a random network of the same size and density
Mean: 0.094 Mean in random network: 0.094 Std.dev: 0.008 Std.dev in random network: 0.027 In-degree centrality
The In Degree Centrality of a node is its normalized in-degree. For any node, e.g. an individual or a resource, the in-links are the connections that the node of interest receives from other nodes. For example, imagine an agent by knowledge matrix then the number of in-links a piece of knowledge has is the number of agents that are connected to. The scientific name of this measure is in-degree and it is calculated on the agent by agent matrices.
Input network(s): organization x organization
Rank Organization Value Unscaled 1 BrighamYoung 0.105 12.000 2 FloridaState 0.105 12.000 3 Iowa 0.105 12.000 4 KansasState 0.105 12.000 5 TexasTech 0.105 12.000 6 PennState 0.105 12.000 7 SouthernCalifornia 0.105 12.000 8 Wisconsin 0.105 12.000 9 SouthernMethodist 0.105 12.000 10 Nevada 0.105 12.000 Out-degree centrality
For any node, e.g. an individual or a resource, the out-links are the connections that the node of interest sends to other nodes. For example, imagine an agent by knowledge matrix then the number of out-links an agent would have is the number of pieces of knowledge it is connected to. The scientific name of this measure is out-degree and it is calculated on the agent by agent matrices. Individuals or organizations who are high in most knowledge have more expertise or are associated with more types of knowledge than are others. If no sub-network connecting agents to knowledge exists, then this measure will not be calculated. The scientific name of this measure is out degree centrality and it is calculated on agent by knowledge matrices. Individuals or organizations who are high in "most resources" have more resources or are associated with more types of resources than are others. If no sub-network connecting agents to resources exists, then this measure will not be calculated. The scientific name of this measure is out degree centrality and it is calculated on agent by resource matrices.
Input network(s): organization x organization
Rank Organization Value Unscaled 1 BrighamYoung 0.105 12.000 2 FloridaState 0.105 12.000 3 Iowa 0.105 12.000 4 KansasState 0.105 12.000 5 TexasTech 0.105 12.000 6 PennState 0.105 12.000 7 SouthernCalifornia 0.105 12.000 8 Wisconsin 0.105 12.000 9 SouthernMethodist 0.105 12.000 10 Nevada 0.105 12.000 Eigenvector centrality
Calculates the principal eigenvector of the network. A node is central to the extent that its neighbors are central. Leaders of strong cliques are individuals who or organizations who are collected to others that are themselves highly connected to each other. In other words, if you have a clique then the individual most connected to others in the clique and other cliques, is the leader of the clique. Individuals or organizations who are connected to many otherwise isolated individuals or organizations will have a much lower score in this measure then those that are connected to groups that have many connections themselves. The scientific name of this measure is eigenvector centrality and it is calculated on agent by agent matrices.
Input network: organization x organization (size: 115, density: 0.0935164)
Rank Organization Value Unscaled Context* 1 Nevada 0.181 0.128 -1.606 2 SouthernMethodist 0.173 0.123 -1.636 3 Tulsa 0.172 0.121 -1.644 4 SouthernCalifornia 0.171 0.121 -1.647 5 SanJoseState 0.170 0.120 -1.652 6 FresnoState 0.169 0.120 -1.654 7 Hawaii 0.166 0.118 -1.666 8 Rice 0.166 0.117 -1.668 9 TexasElPaso 0.165 0.116 -1.673 10 Wisconsin 0.164 0.116 -1.674 * Number of standard deviations from the mean of a random network of the same size and density
Mean: 0.130 Mean in random network: 0.558 Std.dev: 0.023 Std.dev in random network: 0.235 Eigenvector centrality per component
Calculates the principal eigenvector of the network. A node is central to the extent that its neighbors are central. Each component is extracted as a separate network, Eigenvector Centrality is computed on it and scaled according to the component size. The scores are then combined into a single result vector.
Input network(s): organization x organization
Rank Organization Value 1 Nevada 0.128 2 SouthernMethodist 0.123 3 Tulsa 0.121 4 SouthernCalifornia 0.121 5 SanJoseState 0.120 6 FresnoState 0.120 7 Hawaii 0.118 8 Rice 0.117 9 TexasElPaso 0.116 10 Wisconsin 0.116 Closeness centrality
The average closeness of a node to the other nodes in a network (also called out-closeness). Loosely, Closeness is the inverse of the average distance in the network from the node to all other nodes.
Input network: organization x organization (size: 115, density: 0.0935164)
Rank Organization Value Unscaled Context* 1 LouisianaTech 0.437 0.004 0.401 2 Navy 0.435 0.004 0.349 3 Tulsa 0.430 0.004 0.193 4 Indiana 0.427 0.004 0.091 5 PennState 0.425 0.004 0.041 6 BrighamYoung 0.424 0.004 -0.009 7 Wisconsin 0.424 0.004 -0.009 8 Wyoming 0.424 0.004 -0.009 9 ArkansasState 0.424 0.004 -0.009 10 Cincinnati 0.424 0.004 -0.009 * Number of standard deviations from the mean of a random network of the same size and density
Mean: 0.399 Mean in random network: 0.424 Std.dev: 0.016 Std.dev in random network: 0.032 In-Closeness centrality
The average closeness of a node from the other nodes in a network. Loosely, Closeness is the inverse of the average distance in the network to the node and from all other nodes.
Input network(s): organization x organization
Rank Organization Value Unscaled 1 LouisianaTech 0.437 0.004 2 Navy 0.435 0.004 3 Tulsa 0.430 0.004 4 Indiana 0.427 0.004 5 PennState 0.425 0.004 6 BrighamYoung 0.424 0.004 7 Wisconsin 0.424 0.004 8 Wyoming 0.424 0.004 9 ArkansasState 0.424 0.004 10 Cincinnati 0.424 0.004 Betweenness centrality
The Betweenness Centrality of node v in a network is defined as: across all node pairs that have a shortest path containing v, the percentage that pass through v. Individuals or organizations that are potentially influential are positioned to broker connections between groups and to bring to bear the influence of one group on another or serve as a gatekeeper between groups. This agent occurs on many of the shortest paths between other agents. The scientific name of this measure is betweenness centrality and it is calculated on agent by agent matrices.
Input network: organization x organization (size: 115, density: 0.0935164)
Rank Organization Value Unscaled Context* 1 NotreDame 0.034 215.986 0.557 2 BrighamYoung 0.032 209.268 0.527 3 Navy 0.029 187.826 0.432 4 LouisianaTech 0.029 185.648 0.422 5 CentralMichigan 0.025 162.228 0.317 6 NewMexicoState 0.024 155.482 0.287 7 Cincinnati 0.024 153.530 0.278 8 KansasState 0.023 148.595 0.256 9 Alabama 0.023 148.441 0.256 10 Wyoming 0.022 143.077 0.232 * Number of standard deviations from the mean of a random network of the same size and density
Mean: 0.013 Mean in random network: 0.014 Std.dev: 0.006 Std.dev in random network: 0.035 Hub centrality
A node is hub-central to the extent that its out-links are to nodes that have many in-links. Individuals or organizations that act as hubs are sending information to a wide range of others each of whom has many others reporting to them. Technically, an agent is hub-central if its out-links are to agents that have many other agents sending links to them. The scientific name of this measure is hub centrality and it is calculated on agent by agent matrices.
Input network(s): organization x organization
Rank Organization Value 1 Nevada 0.181 2 SouthernMethodist 0.173 3 Tulsa 0.172 4 SouthernCalifornia 0.171 5 SanJoseState 0.170 6 FresnoState 0.169 7 Hawaii 0.166 8 Rice 0.166 9 TexasElPaso 0.165 10 Wisconsin 0.164 Authority centrality
A node is authority-central to the extent that its in-links are from nodes that have many out-links. Individuals or organizations that act as authorities are receiving information from a wide range of others each of whom sends information to a large number of others. Technically, an agent is authority-central if its in-links are from agents that have are sending links to many others. The scientific name of this measure is authority centrality and it is calculated on agent by agent matrices.
Input network(s): organization x organization
Rank Organization Value 1 Nevada 0.181 2 SouthernMethodist 0.173 3 Tulsa 0.172 4 SouthernCalifornia 0.171 5 SanJoseState 0.170 6 FresnoState 0.169 7 Hawaii 0.166 8 Rice 0.166 9 TexasElPaso 0.165 10 Wisconsin 0.164 Information centrality
Calculate the Stephenson and Zelen information centrality measure for each node.
Input network(s): organization x organization
Rank Organization Value Unscaled 1 BrighamYoung 0.009 4.728 2 PennState 0.009 4.723 3 Wisconsin 0.009 4.714 4 NevadaLasVegas 0.009 4.702 5 Iowa 0.009 4.700 6 KansasState 0.009 4.681 7 SouthernMethodist 0.009 4.661 8 Tulsa 0.009 4.660 9 NotreDame 0.009 4.657 10 Navy 0.009 4.629 Clique membership count
The number of distinct cliques to which each node belongs. Individuals or organizations who are high in number of cliques are those that belong to a large number of distinct cliques. A clique is defined as a group of three or more actors that have many connections to each other and relatively fewer connections to those in other groups. The scientific name of this measure is clique count and it is calculated on the agent by agent matrices.
Input network(s): organization x organization
Rank Organization Value 1 Arizona 20.000 2 WashingtonState 20.000 3 SouthernCalifornia 18.000 4 ArizonaState 18.000 5 Stanford 18.000 6 OregonState 18.000 7 California 18.000 8 UCLA 17.000 9 Washington 17.000 10 Oregon 17.000 Simmelian ties
The normalized number of Simmelian ties of each node.
Input network(s): organization x organization
Rank Organization Value Unscaled 1 Iowa 0.105 12.000 2 TexasTech 0.096 11.000 3 Akron 0.096 11.000 4 Utah 0.096 11.000 5 Buffalo 0.096 11.000 6 Purdue 0.096 11.000 7 Nevada 0.096 11.000 8 Tennessee 0.096 11.000 9 WashingtonState 0.096 11.000 10 Temple 0.096 11.000 Clustering coefficient
Measures the degree of clustering in a network by averaging the clustering coefficient of each node, which is defined as the density of the node's ego network.
Input network(s): organization x organization
Rank Organization Value 1 WakeForest 0.667 2 Virginia 0.644 3 Clemson 0.622 4 Rutgers 0.600 5 OregonState 0.578 6 TexasElPaso 0.564 7 Rice 0.545 8 Hawaii 0.545 9 ColoradoState 0.533 10 GeorgiaTech 0.527
Key Nodes Table
This shows the top scoring nodes side-by-side for selected measures.
Rank Betweenness centrality Closeness centrality Eigenvector centrality Eigenvector centrality per component In-degree centrality In-Closeness centrality Out-degree centrality Total degree centrality 1 NotreDame LouisianaTech Nevada Nevada BrighamYoung LouisianaTech BrighamYoung BrighamYoung 2 BrighamYoung Navy SouthernMethodist SouthernMethodist FloridaState Navy FloridaState FloridaState 3 Navy Tulsa Tulsa Tulsa Iowa Tulsa Iowa Iowa 4 LouisianaTech Indiana SouthernCalifornia SouthernCalifornia KansasState Indiana KansasState KansasState 5 CentralMichigan PennState SanJoseState SanJoseState TexasTech PennState TexasTech TexasTech 6 NewMexicoState BrighamYoung FresnoState FresnoState PennState BrighamYoung PennState PennState 7 Cincinnati Wisconsin Hawaii Hawaii SouthernCalifornia Wisconsin SouthernCalifornia SouthernCalifornia 8 KansasState Wyoming Rice Rice Wisconsin Wyoming Wisconsin Wisconsin 9 Alabama ArkansasState TexasElPaso TexasElPaso SouthernMethodist ArkansasState SouthernMethodist SouthernMethodist 10 Wyoming Cincinnati Wisconsin Wisconsin Nevada Cincinnati Nevada Nevada