Calculates common social network measures on each selected input network.
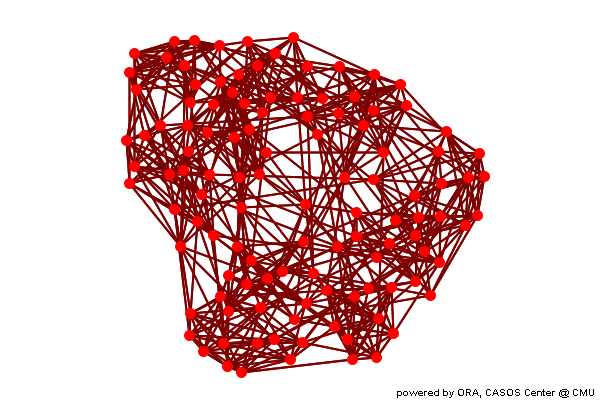
Analysis for the Meta-Network
Individual entity classes have been combined into a single class, and all networks are combined to create a single network. If two networks connect the same entities, e.g. two agent x agent, then the links are combined. Link weights are made binary.
Row count 115 Column count 115 Link count 1226 Density 0.09352 Isolate count 0 Component count 1 Reciprocity 1 Characteristic path length 2.508 Clustering coefficient 0.4032 Network levels (diameter) 4 Network fragmentation 0 Krackhardt connectedness 1 Krackhardt efficiency 0.9225 Krackhardt hierarchy 0 Krackhardt upperboundedness 1 Degree centralization 0.01195 Betweenness centralization 0.02036 Closeness centralization 0.07592
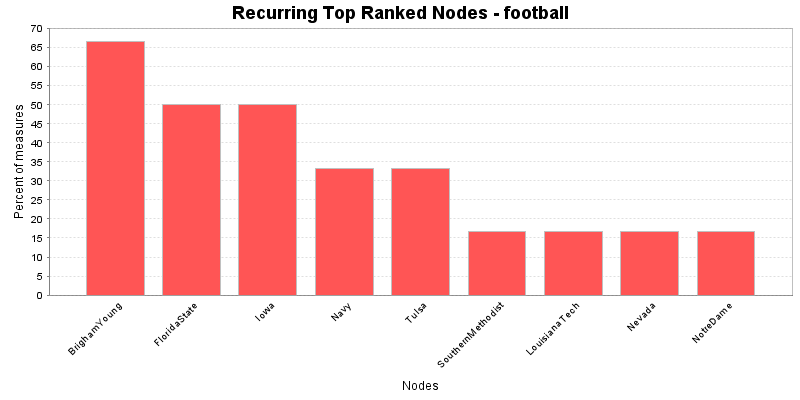
Min Max Average Stddev Total degree centrality 0.0614 0.1053 0.09352 0.00775 Total degree centrality (unscaled) 14 24 21.32 1.767 Eigenvector centrality 0.3783 1 0.7186 0.1298 Hub centrality 0.3783 1 0.7186 0.1298 Authority centrality 0.3783 1 0.7186 0.1298 Betweenness centrality 0.003002 0.03353 0.01335 0.005978 Betweenness centrality (unscaled) 38.67 432 171.9 77.01 Information centrality 0.007157 0.009362 0.008696 0.000364 Information centrality (unscaled) 3.614 4.728 4.391 0.1838 Clique membership count 1 20 6.617 4.454 Simmelian ties 0.03509 0.1053 0.07887 0.0116 Simmelian ties (unscaled) 4 12 8.991 1.322 Clustering coefficient 0.1111 0.6667 0.4032 0.1038 Key nodes
This chart shows the Nodes that repeatedly rank in the top three in the measures. The value shown is the percentage of measures for which the Nodes was ranked in the top three.
In-degree centrality
The In Degree Centrality of a node is its normalized in-degree.
Input network(s): meta-network
Rank Value Unscaled Nodes 1 0.105263 12 BrighamYoung 2 0.105263 12 FloridaState 3 0.105263 12 Iowa 4 0.105263 12 KansasState 5 0.105263 12 TexasTech 6 0.105263 12 PennState 7 0.105263 12 SouthernCalifornia 8 0.105263 12 Wisconsin 9 0.105263 12 SouthernMethodist 10 0.105263 12 Nevada Out-degree centrality
The Out Degree Centrality of a node is its normalized out-degree.
Input network(s): meta-network
Rank Value Unscaled Nodes 1 0.105263 12 BrighamYoung 2 0.105263 12 FloridaState 3 0.105263 12 Iowa 4 0.105263 12 KansasState 5 0.105263 12 TexasTech 6 0.105263 12 PennState 7 0.105263 12 SouthernCalifornia 8 0.105263 12 Wisconsin 9 0.105263 12 SouthernMethodist 10 0.105263 12 Nevada Total degree centrality
The Total Degree Centrality of a node is the normalized sum of its row and column degrees.
Input network(s): meta-network
Input network size: 115
Input network density: 0.0935164
Expected value from a random network of the same size and density: 0.0935164
Rank Value Unscaled Nodes Context* 1 0.105263 24 BrighamYoung 0.432656 2 0.105263 24 FloridaState 0.432656 3 0.105263 24 Iowa 0.432656 4 0.105263 24 KansasState 0.432656 5 0.105263 24 TexasTech 0.432656 6 0.105263 24 PennState 0.432656 7 0.105263 24 SouthernCalifornia 0.432656 8 0.105263 24 Wisconsin 0.432656 9 0.105263 24 SouthernMethodist 0.432656 10 0.105263 24 Nevada 0.432656 * Number of standard deviations from the mean if links were distributed randomly Mean: 0.0935164 Std.dev: 0.0271503 Eigenvector centrality
Calculates the principal eigenvector of the network. A node is central to the extent that its neighbors are central.
Input network(s): meta-network
Input network size: 115
Input network density: 0.0935164
Expected value from a random network of the same size and density: 0.557957
Rank Value Nodes Context* 1 1 Nevada 1.88063 2 0.959977 SouthernMethodist 1.71036 3 0.949896 Tulsa 1.66747 4 0.945516 SouthernCalifornia 1.64883 5 0.939065 SanJoseState 1.62139 6 0.936443 FresnoState 1.61023 7 0.921763 Hawaii 1.54778 8 0.918243 Rice 1.5328 9 0.912185 TexasElPaso 1.50703 10 0.910807 Wisconsin 1.50116 * Number of standard deviations from the mean if links were distributed randomly Mean: 0.557957 Std.dev: 0.235051 Betweenness centrality
The Betweenness Centrality of node v in a network is defined as: across all node pairs that have a shortest path containing v, the percentage that pass through v.
Input network(s): meta-network
Input network size: 115
Input network density: 0.0935164
Expected value from a random network of the same size and density: 0.0141546
Rank Value Unscaled Nodes Context* 1 0.033533 431.972 NotreDame 0.557339 2 0.0324899 418.536 BrighamYoung 0.527341 3 0.0291611 375.653 Navy 0.431599 4 0.0288228 371.296 LouisianaTech 0.421871 5 0.0251868 324.456 CentralMichigan 0.317296 6 0.0241394 310.964 NewMexicoState 0.287172 7 0.0238364 307.06 Cincinnati 0.278456 8 0.0230701 297.189 KansasState 0.256418 9 0.0230463 296.883 Alabama 0.255734 10 0.0222134 286.154 Wyoming 0.23178 * Number of standard deviations from the mean if links were distributed randomly Mean: 0.0141546 Std.dev: 0.0347694 Closeness centrality
The average closeness of a node to the other nodes in a network. Loosely, Closeness is the inverse of the average distance in the network between the node and all other nodes.
Input network(s): meta-network
Input network size: 115
Input network density: 0.0935164
Expected value from a random network of the same size and density: 0.42408
Rank Value Unscaled Nodes Context* 1 0.436782 0.00383142 LouisianaTech 0.401252 2 0.435115 0.00381679 Navy 0.348587 3 0.430189 0.00377358 Tulsa 0.192976 4 0.426966 0.00374532 Indiana 0.0911779 5 0.425373 0.00373134 PennState 0.0408481 6 0.423792 0.00371747 BrighamYoung -0.00910697 7 0.423792 0.00371747 Wisconsin -0.00910697 8 0.423792 0.00371747 Wyoming -0.00910697 9 0.423792 0.00371747 ArkansasState -0.00910697 10 0.423792 0.00371747 Cincinnati -0.00910697 * Number of standard deviations from the mean if links were distributed randomly Mean: 0.42408 Std.dev: 0.0316547