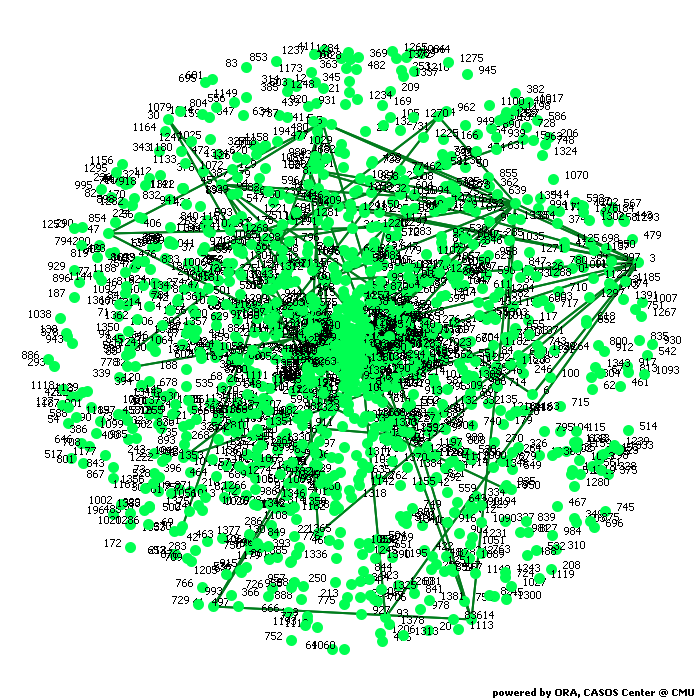
Calculates common social network measures on each selected input network.
Network agent x agent
Block Model - Newman's Clustering Algorithm
Network Level Measures
Measure Value Row count 8361.000 Column count 8361.000 Link count 15751.000 Density 0.000 Components of 1 node (isolates) 751 Components of 2 nodes (dyadic isolates) 323 Components of 3 or more nodes 258 Reciprocity 1.000 Characteristic path length 4.579 Clustering coefficient 0.442 Network levels (diameter) 27.389 Network fragmentation 0.513 Krackhardt connectedness 0.487 Krackhardt efficiency 0.999 Krackhardt hierarchy 0.000 Krackhardt upperboundedness 1.000 Degree centralization 0.000 Betweenness centralization 0.041 Closeness centralization 0.000 Eigenvector centralization 0.914 Reciprocal (symmetric)? Yes
Node Level Measures
Measure Min Max Avg Stddev Total degree centrality 0.000 0.000 0.000 0.000 Total degree centrality [Unscaled] 0.000 78.000 3.666 5.278 In-degree centrality 0.000 0.000 0.000 0.000 In-degree centrality [Unscaled] 0.000 78.000 3.666 5.278 Out-degree centrality 0.000 0.000 0.000 0.000 Out-degree centrality [Unscaled] 0.000 78.000 3.666 5.278 Eigenvector centrality 0.000 0.914 0.001 0.015 Eigenvector centrality [Unscaled] 0.000 0.647 0.000 0.011 Eigenvector centrality per component 0.000 0.451 0.000 0.008 Closeness centrality 0.000 0.000 0.000 0.000 Closeness centrality [Unscaled] 0.000 0.000 0.000 0.000 In-Closeness centrality 0.000 0.000 0.000 0.000 In-Closeness centrality [Unscaled] 0.000 0.000 0.000 0.000 Betweenness centrality 0.000 0.042 0.000 0.002 Betweenness centrality [Unscaled] 0.000 1464791.875 16648.333 56914.743 Hub centrality 0.000 0.914 0.001 0.015 Authority centrality 0.000 0.914 0.001 0.015 Clique membership count 0.000 36.000 1.513 2.489 Simmelian ties 0.000 0.006 0.000 0.001 Simmelian ties [Unscaled] 0.000 49.000 3.183 4.211 Clustering coefficient 0.000 1.000 0.442 0.423
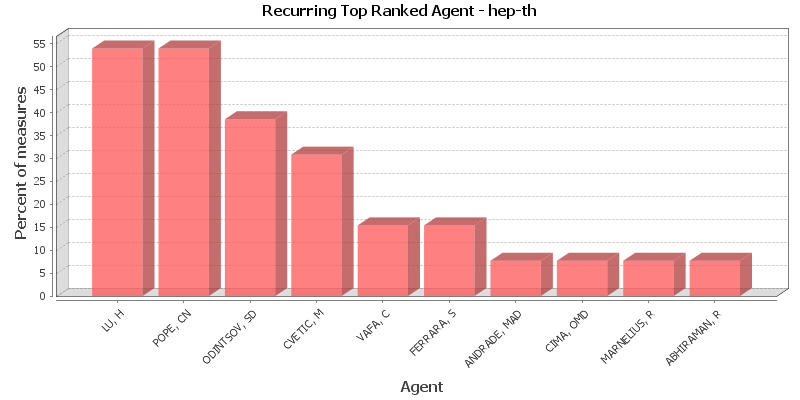
Key Nodes
This chart shows the Agent that is repeatedly top-ranked in the measures listed below. The value shown is the percentage of measures for which the Agent was ranked in the top three.
Total degree centrality
The Total Degree Centrality of a node is the normalized sum of its row and column degrees. Individuals or organizations who are "in the know" are those who are linked to many others and so, by virtue of their position have access to the ideas, thoughts, beliefs of many others. Individuals who are "in the know" are identified by degree centrality in the relevant social network. Those who are ranked high on this metrics have more connections to others in the same network. The scientific name of this measure is total degree centrality and it is calculated on the agent by agent matrices.
Input network: agent x agent (size: 8361, density: 0.000450686)
Rank Agent Value Unscaled Context* 1 ODINTSOV, SD 0.000 78.000 -0.760 2 LU, H 0.000 73.000 -0.836 3 POPE, CN 0.000 72.000 -0.851 4 CVETIC, M 0.000 67.000 -0.926 5 FERRARA, S 0.000 63.000 -0.987 6 MAVROMATOS, NE 0.000 62.000 -1.002 7 VAFA, C 0.000 53.000 -1.139 8 KOGAN, II 0.000 49.000 -1.199 9 AMBJORN, J 0.000 49.000 -1.199 10 OVRUT, BA 0.000 46.000 -1.245 * Number of standard deviations from the mean of a random network of the same size and density
Mean: 0.000 Mean in random network: 0.000 Std.dev: 0.000 Std.dev in random network: 0.000 In-degree centrality
The In Degree Centrality of a node is its normalized in-degree. For any node, e.g. an individual or a resource, the in-links are the connections that the node of interest receives from other nodes. For example, imagine an agent by knowledge matrix then the number of in-links a piece of knowledge has is the number of agents that are connected to. The scientific name of this measure is in-degree and it is calculated on the agent by agent matrices.
Input network(s): agent x agent
Rank Agent Value Unscaled 1 ODINTSOV, SD 0.000 78.000 2 LU, H 0.000 73.000 3 POPE, CN 0.000 72.000 4 CVETIC, M 0.000 67.000 5 FERRARA, S 0.000 63.000 6 MAVROMATOS, NE 0.000 62.000 7 VAFA, C 0.000 53.000 8 KOGAN, II 0.000 49.000 9 AMBJORN, J 0.000 49.000 10 OVRUT, BA 0.000 46.000 Out-degree centrality
For any node, e.g. an individual or a resource, the out-links are the connections that the node of interest sends to other nodes. For example, imagine an agent by knowledge matrix then the number of out-links an agent would have is the number of pieces of knowledge it is connected to. The scientific name of this measure is out-degree and it is calculated on the agent by agent matrices. Individuals or organizations who are high in most knowledge have more expertise or are associated with more types of knowledge than are others. If no sub-network connecting agents to knowledge exists, then this measure will not be calculated. The scientific name of this measure is out degree centrality and it is calculated on agent by knowledge matrices. Individuals or organizations who are high in "most resources" have more resources or are associated with more types of resources than are others. If no sub-network connecting agents to resources exists, then this measure will not be calculated. The scientific name of this measure is out degree centrality and it is calculated on agent by resource matrices.
Input network(s): agent x agent
Rank Agent Value Unscaled 1 ODINTSOV, SD 0.000 78.000 2 LU, H 0.000 73.000 3 POPE, CN 0.000 72.000 4 CVETIC, M 0.000 67.000 5 FERRARA, S 0.000 63.000 6 MAVROMATOS, NE 0.000 62.000 7 VAFA, C 0.000 53.000 8 KOGAN, II 0.000 49.000 9 AMBJORN, J 0.000 49.000 10 OVRUT, BA 0.000 46.000 Eigenvector centrality
Calculates the principal eigenvector of the network. A node is central to the extent that its neighbors are central. Leaders of strong cliques are individuals who or organizations who are collected to others that are themselves highly connected to each other. In other words, if you have a clique then the individual most connected to others in the clique and other cliques, is the leader of the clique. Individuals or organizations who are connected to many otherwise isolated individuals or organizations will have a much lower score in this measure then those that are connected to groups that have many connections themselves. The scientific name of this measure is eigenvector centrality and it is calculated on agent by agent matrices.
Input network: agent x agent (size: 8361, density: 0.000450686)
Rank Agent Value Unscaled Context* 1 LU, H 0.914 0.647 11.697 2 POPE, CN 0.912 0.645 11.720 3 CVETIC, M 0.360 0.255 16.407 4 STELLE, KS 0.240 0.170 17.426 5 DUFF, MJ 0.182 0.129 17.920 6 XU, KW 0.125 0.089 18.404 7 TRAN, TA 0.122 0.086 18.433 8 SEZGIN, E 0.106 0.075 18.566 9 LAVRINENKO, IV 0.105 0.074 18.574 10 YOUM, D 0.090 0.064 18.704 * Number of standard deviations from the mean of a random network of the same size and density
Mean: 0.001 Mean in random network: 2.291 Std.dev: 0.015 Std.dev in random network: -0.118 Eigenvector centrality per component
Calculates the principal eigenvector of the network. A node is central to the extent that its neighbors are central. Each component is extracted as a separate network, Eigenvector Centrality is computed on it and scaled according to the component size. The scores are then combined into a single result vector.
Input network(s): agent x agent
Rank Agent Value 1 LU, H 0.451 2 POPE, CN 0.450 3 CVETIC, M 0.178 4 STELLE, KS 0.119 5 DUFF, MJ 0.090 6 XU, KW 0.062 7 TRAN, TA 0.060 8 SEZGIN, E 0.052 9 LAVRINENKO, IV 0.052 10 YOUM, D 0.044 Closeness centrality
The average closeness of a node to the other nodes in a network (also called out-closeness). Loosely, Closeness is the inverse of the average distance in the network from the node to all other nodes.
Input network: agent x agent (size: 8361, density: 0.000450686)
Rank Agent Value Unscaled Context* 1 All nodes have this value 0.000 * Number of standard deviations from the mean of a random network of the same size and density
Mean: 0.000 Mean in random network: 7.376 Std.dev: 0.000 Std.dev in random network: 6.044 In-Closeness centrality
The average closeness of a node from the other nodes in a network. Loosely, Closeness is the inverse of the average distance in the network to the node and from all other nodes.
Input network(s): agent x agent
Rank Agent Value Unscaled 1 All nodes have this value 0.000 Betweenness centrality
The Betweenness Centrality of node v in a network is defined as: across all node pairs that have a shortest path containing v, the percentage that pass through v. Individuals or organizations that are potentially influential are positioned to broker connections between groups and to bring to bear the influence of one group on another or serve as a gatekeeper between groups. This agent occurs on many of the shortest paths between other agents. The scientific name of this measure is betweenness centrality and it is calculated on agent by agent matrices.
Input network: agent x agent (size: 8361, density: 0.000450686)
Rank Agent Value Unscaled Context* 1 FRE, P 0.042 1464791.875 0.010 2 MINASIAN, R 0.041 1419623.750 0.010 3 ODINTSOV, SD 0.025 860516.875 0.006 4 HENNEAUX, M 0.021 728067.875 0.005 5 TRIGIANTE, M 0.021 720792.125 0.005 6 NUNEZ, C 0.020 713722.750 0.005 7 THEISEN, S 0.020 690337.375 0.005 8 REGGE, T 0.018 634478.813 0.004 9 ELLIS, J 0.018 624736.063 0.004 10 AMBJORN, J 0.018 617552.250 0.004 * Number of standard deviations from the mean of a random network of the same size and density
Mean: 0.000 Mean in random network: -0.002 Std.dev: 0.002 Std.dev in random network: 4.374 Hub centrality
A node is hub-central to the extent that its out-links are to nodes that have many in-links. Individuals or organizations that act as hubs are sending information to a wide range of others each of whom has many others reporting to them. Technically, an agent is hub-central if its out-links are to agents that have many other agents sending links to them. The scientific name of this measure is hub centrality and it is calculated on agent by agent matrices.
Input network(s): agent x agent
Rank Agent Value 1 LU, H 0.914 2 POPE, CN 0.912 3 CVETIC, M 0.360 4 STELLE, KS 0.240 5 DUFF, MJ 0.182 6 XU, KW 0.125 7 TRAN, TA 0.122 8 SEZGIN, E 0.106 9 LAVRINENKO, IV 0.105 10 YOUM, D 0.090 Authority centrality
A node is authority-central to the extent that its in-links are from nodes that have many out-links. Individuals or organizations that act as authorities are receiving information from a wide range of others each of whom sends information to a large number of others. Technically, an agent is authority-central if its in-links are from agents that have are sending links to many others. The scientific name of this measure is authority centrality and it is calculated on agent by agent matrices.
Input network(s): agent x agent
Rank Agent Value 1 LU, H 0.914 2 POPE, CN 0.912 3 CVETIC, M 0.360 4 STELLE, KS 0.240 5 DUFF, MJ 0.182 6 XU, KW 0.125 7 TRAN, TA 0.122 8 SEZGIN, E 0.106 9 LAVRINENKO, IV 0.105 10 YOUM, D 0.090 Clique membership count
The number of distinct cliques to which each node belongs. Individuals or organizations who are high in number of cliques are those that belong to a large number of distinct cliques. A clique is defined as a group of three or more actors that have many connections to each other and relatively fewer connections to those in other groups. The scientific name of this measure is clique count and it is calculated on the agent by agent matrices.
Input network(s): agent x agent
Rank Agent Value 1 VAFA, C 36.000 2 FERRARA, S 36.000 3 SEIBERG, N 36.000 4 ODINTSOV, SD 34.000 5 AMBJORN, J 31.000 6 STROMINGER, A 29.000 7 DOUGLAS, MR 29.000 8 TOWNSEND, PK 27.000 9 KALLOSH, R 27.000 10 PROEYEN, AV 25.000 Simmelian ties
The normalized number of Simmelian ties of each node.
Input network(s): agent x agent
Rank Agent Value Unscaled 1 AMBJORN, J 0.006 49.000 2 FERRARA, S 0.005 44.000 3 VAFA, C 0.005 38.000 4 KOGAN, II 0.004 37.000 5 ODINTSOV, SD 0.004 36.000 6 PROEYEN, AV 0.004 36.000 7 ELLIS, J 0.004 35.000 8 FRE, P 0.004 35.000 9 LU, H 0.004 34.000 10 KALLOSH, R 0.004 33.000 Clustering coefficient
Measures the degree of clustering in a network by averaging the clustering coefficient of each node, which is defined as the density of the node's ego network.
Input network(s): agent x agent
Rank Agent Value 1 ABHIRAMAN, R 1.000 2 SOMMERFIELD, CM 1.000 3 UNIVERSITY, Y 1.000 4 KARKOWSKI, J 1.000 5 SWIERCZYNSKI, Z 1.000 6 NAFTULIN, S 1.000 7 MATVEEV, VI 1.000 8 MATRASULOV, DU 1.000 9 DANILOV, GS 1.000 10 C, DJF 1.000
Key Nodes Table
This shows the top scoring nodes side-by-side for selected measures.
Rank Betweenness centrality Closeness centrality Eigenvector centrality Eigenvector centrality per component In-degree centrality In-Closeness centrality Out-degree centrality Total degree centrality 1 FRE, P ANDRADE, MAD LU, H LU, H ODINTSOV, SD NAFTULIN, S ODINTSOV, SD ODINTSOV, SD 2 MINASIAN, R CIMA, OMD POPE, CN POPE, CN LU, H ELIZALDE, E LU, H LU, H 3 ODINTSOV, SD MARNELIUS, R CVETIC, M CVETIC, M POPE, CN ODINTSOV, SD POPE, CN POPE, CN 4 HENNEAUX, M QUAADE, U STELLE, KS STELLE, KS CVETIC, M DORN, H CVETIC, M CVETIC, M 5 TRIGIANTE, M BATALIN, I DUFF, MJ DUFF, MJ FERRARA, S KOUNNAS, C FERRARA, S FERRARA, S 6 NUNEZ, C ROSGEN, M XU, KW XU, KW MAVROMATOS, NE HARVEY, JA MAVROMATOS, NE MAVROMATOS, NE 7 THEISEN, S VARNHAGEN, R TRAN, TA TRAN, TA VAFA, C MOORE, G VAFA, C VAFA, C 8 REGGE, T HORVATH, Z SEZGIN, E SEZGIN, E KOGAN, II STROMINGER, A KOGAN, II KOGAN, II 9 ELLIS, J TAKACS, G LAVRINENKO, IV LAVRINENKO, IV AMBJORN, J KUTASOV, D AMBJORN, J AMBJORN, J 10 AMBJORN, J WEGRZYN, P YOUM, D YOUM, D OVRUT, BA SCHWIMMER, A OVRUT, BA OVRUT, BA