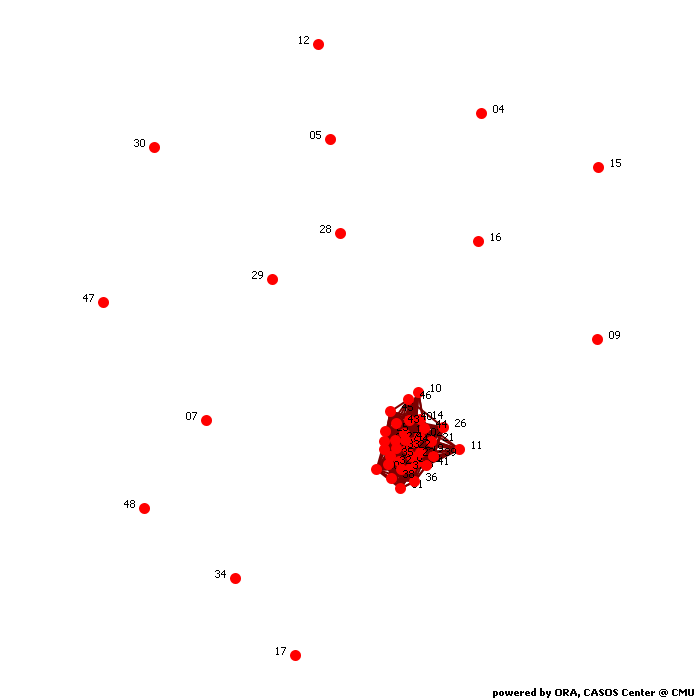
Calculates common social network measures on each selected input network.
Network agent x agent
Network Level Measures
Measure Value Row count 48.000 Column count 48.000 Link count 695.000 Density 0.308 Components of 1 node (isolates) 14 Components of 2 nodes (dyadic isolates) 0 Components of 3 or more nodes 1 Reciprocity 0.675 Characteristic path length 2.289 Clustering coefficient 0.519 Network levels (diameter) 5.000 Network fragmentation 0.503 Krackhardt connectedness 0.497 Krackhardt efficiency 0.277 Krackhardt hierarchy 0.000 Krackhardt upperboundedness 1.000 Degree centralization 0.267 Betweenness centralization 0.033 Closeness centralization 0.007 Eigenvector centralization 0.197 Reciprocal (symmetric)? No (67% of the links are reciprocal)
Node Level Measures
Measure Min Max Avg Stddev Total degree centrality 0.000 0.415 0.159 0.124 Total degree centrality [Unscaled] 0.000 156.000 59.917 46.576 In-degree centrality 0.000 0.447 0.159 0.130 In-degree centrality [Unscaled] 0.000 84.000 29.958 24.466 Out-degree centrality 0.000 0.410 0.159 0.123 Out-degree centrality [Unscaled] 0.000 77.000 29.958 23.031 Eigenvector centrality 0.000 0.354 0.165 0.120 Eigenvector centrality [Unscaled] 0.000 0.250 0.117 0.085 Eigenvector centrality per component 0.000 0.177 0.083 0.060 Closeness centrality 0.005 0.017 0.014 0.005 Closeness centrality [Unscaled] 0.000 0.000 0.000 0.000 In-Closeness centrality 0.005 0.017 0.014 0.005 In-Closeness centrality [Unscaled] 0.000 0.000 0.000 0.000 Betweenness centrality 0.000 0.040 0.007 0.009 Betweenness centrality [Unscaled] 0.000 85.714 15.869 19.842 Hub centrality 0.000 0.405 0.163 0.123 Authority centrality 0.000 0.399 0.159 0.128 Information centrality 0.000 0.040 0.021 0.014 Information centrality [Unscaled] 0.000 30.427 15.786 10.962 Clique membership count 0.000 120.000 35.979 37.385 Simmelian ties 0.000 0.702 0.248 0.206 Simmelian ties [Unscaled] 0.000 33.000 11.667 9.668 Clustering coefficient 0.000 0.903 0.519 0.338
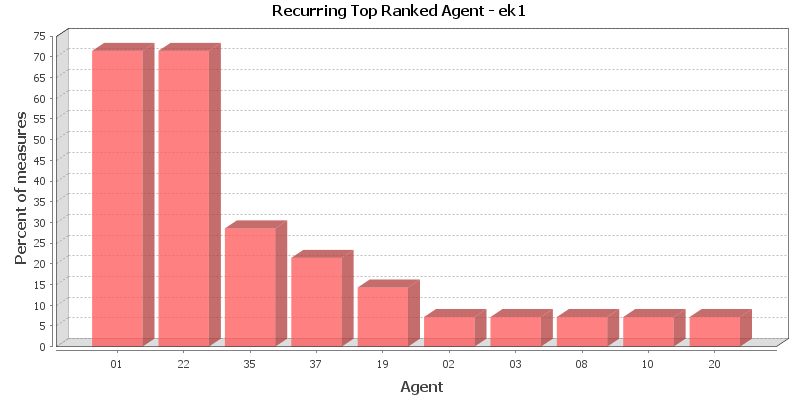
Key Nodes
This chart shows the Agent that is repeatedly top-ranked in the measures listed below. The value shown is the percentage of measures for which the Agent was ranked in the top three.
Total degree centrality
The Total Degree Centrality of a node is the normalized sum of its row and column degrees. Individuals or organizations who are "in the know" are those who are linked to many others and so, by virtue of their position have access to the ideas, thoughts, beliefs of many others. Individuals who are "in the know" are identified by degree centrality in the relevant social network. Those who are ranked high on this metrics have more connections to others in the same network. The scientific name of this measure is total degree centrality and it is calculated on the agent by agent matrices.
Input network: agent x agent (size: 48, density: 0.308067)
Rank Agent Value Unscaled Context* 1 01 0.415 156.000 1.603 2 22 0.383 144.000 1.124 3 02 0.319 120.000 0.166 4 33 0.314 118.000 0.086 5 37 0.309 116.000 0.007 6 42 0.303 114.000 -0.073 7 35 0.301 113.000 -0.113 8 03 0.282 106.000 -0.392 9 13 0.279 105.000 -0.432 10 32 0.279 105.000 -0.432 * Number of standard deviations from the mean of a random network of the same size and density
Mean: 0.159 Mean in random network: 0.308 Std.dev: 0.124 Std.dev in random network: 0.067 In-degree centrality
The In Degree Centrality of a node is its normalized in-degree. For any node, e.g. an individual or a resource, the in-links are the connections that the node of interest receives from other nodes. For example, imagine an agent by knowledge matrix then the number of in-links a piece of knowledge has is the number of agents that are connected to. The scientific name of this measure is in-degree and it is calculated on the agent by agent matrices.
Input network(s): agent x agent
Rank Agent Value Unscaled 1 01 0.447 84.000 2 22 0.356 67.000 3 35 0.351 66.000 4 13 0.346 65.000 5 42 0.324 61.000 6 02 0.319 60.000 7 33 0.319 60.000 8 24 0.298 56.000 9 03 0.293 55.000 10 37 0.293 55.000 Out-degree centrality
For any node, e.g. an individual or a resource, the out-links are the connections that the node of interest sends to other nodes. For example, imagine an agent by knowledge matrix then the number of out-links an agent would have is the number of pieces of knowledge it is connected to. The scientific name of this measure is out-degree and it is calculated on the agent by agent matrices. Individuals or organizations who are high in most knowledge have more expertise or are associated with more types of knowledge than are others. If no sub-network connecting agents to knowledge exists, then this measure will not be calculated. The scientific name of this measure is out degree centrality and it is calculated on agent by knowledge matrices. Individuals or organizations who are high in "most resources" have more resources or are associated with more types of resources than are others. If no sub-network connecting agents to resources exists, then this measure will not be calculated. The scientific name of this measure is out degree centrality and it is calculated on agent by resource matrices.
Input network(s): agent x agent
Rank Agent Value Unscaled 1 22 0.410 77.000 2 01 0.383 72.000 3 37 0.324 61.000 4 02 0.319 60.000 5 33 0.309 58.000 6 44 0.293 55.000 7 18 0.282 53.000 8 42 0.282 53.000 9 03 0.271 51.000 10 32 0.271 51.000 Eigenvector centrality
Calculates the principal eigenvector of the network. A node is central to the extent that its neighbors are central. Leaders of strong cliques are individuals who or organizations who are collected to others that are themselves highly connected to each other. In other words, if you have a clique then the individual most connected to others in the clique and other cliques, is the leader of the clique. Individuals or organizations who are connected to many otherwise isolated individuals or organizations will have a much lower score in this measure then those that are connected to groups that have many connections themselves. The scientific name of this measure is eigenvector centrality and it is calculated on agent by agent matrices.
Input network: agent x agent (size: 48, density: 0.308067)
Rank Agent Value Unscaled Context* 1 22 0.354 0.250 -0.995 2 01 0.353 0.250 -0.996 3 35 0.316 0.223 -1.116 4 37 0.308 0.218 -1.143 5 33 0.305 0.216 -1.151 6 03 0.294 0.208 -1.187 7 13 0.291 0.206 -1.197 8 02 0.289 0.204 -1.202 9 42 0.283 0.200 -1.222 10 24 0.281 0.198 -1.230 * Number of standard deviations from the mean of a random network of the same size and density
Mean: 0.165 Mean in random network: 0.663 Std.dev: 0.120 Std.dev in random network: 0.311 Eigenvector centrality per component
Calculates the principal eigenvector of the network. A node is central to the extent that its neighbors are central. Each component is extracted as a separate network, Eigenvector Centrality is computed on it and scaled according to the component size. The scores are then combined into a single result vector.
Input network(s): agent x agent
Rank Agent Value 1 22 0.177 2 01 0.177 3 35 0.158 4 37 0.154 5 33 0.153 6 03 0.147 7 13 0.146 8 02 0.145 9 42 0.142 10 24 0.141 Closeness centrality
The average closeness of a node to the other nodes in a network (also called out-closeness). Loosely, Closeness is the inverse of the average distance in the network from the node to all other nodes.
Input network: agent x agent (size: 48, density: 0.308067)
Rank Agent Value Unscaled Context* 1 39 0.017 0.000 -20.529 2 21 0.017 0.000 -20.530 3 19 0.017 0.000 -20.530 4 40 0.017 0.000 -20.530 5 03 0.017 0.000 -20.531 6 36 0.017 0.000 -20.532 7 01 0.017 0.000 -20.532 8 41 0.017 0.000 -20.532 9 44 0.017 0.000 -20.532 10 08 0.017 0.000 -20.532 * Number of standard deviations from the mean of a random network of the same size and density
Mean: 0.014 Mean in random network: 0.591 Std.dev: 0.005 Std.dev in random network: 0.028 In-Closeness centrality
The average closeness of a node from the other nodes in a network. Loosely, Closeness is the inverse of the average distance in the network to the node and from all other nodes.
Input network(s): agent x agent
Rank Agent Value Unscaled 1 08 0.017 0.000 2 27 0.017 0.000 3 23 0.017 0.000 4 41 0.017 0.000 5 24 0.017 0.000 6 18 0.017 0.000 7 19 0.017 0.000 8 03 0.017 0.000 9 42 0.017 0.000 10 32 0.017 0.000 Betweenness centrality
The Betweenness Centrality of node v in a network is defined as: across all node pairs that have a shortest path containing v, the percentage that pass through v. Individuals or organizations that are potentially influential are positioned to broker connections between groups and to bring to bear the influence of one group on another or serve as a gatekeeper between groups. This agent occurs on many of the shortest paths between other agents. The scientific name of this measure is betweenness centrality and it is calculated on agent by agent matrices.
Input network: agent x agent (size: 48, density: 0.308067)
Rank Agent Value Unscaled Context* 1 19 0.040 85.714 1.947 2 41 0.029 63.006 0.925 3 03 0.026 55.245 0.576 4 23 0.021 46.405 0.178 5 08 0.021 44.367 0.087 6 40 0.019 41.878 -0.025 7 33 0.019 41.525 -0.041 8 01 0.019 41.370 -0.048 9 27 0.019 41.105 -0.060 10 22 0.014 29.856 -0.566 * Number of standard deviations from the mean of a random network of the same size and density
Mean: 0.007 Mean in random network: 0.020 Std.dev: 0.009 Std.dev in random network: 0.010 Hub centrality
A node is hub-central to the extent that its out-links are to nodes that have many in-links. Individuals or organizations that act as hubs are sending information to a wide range of others each of whom has many others reporting to them. Technically, an agent is hub-central if its out-links are to agents that have many other agents sending links to them. The scientific name of this measure is hub centrality and it is calculated on agent by agent matrices.
Input network(s): agent x agent
Rank Agent Value 1 22 0.405 2 37 0.342 3 01 0.325 4 33 0.321 5 02 0.298 6 32 0.294 7 18 0.286 8 38 0.283 9 35 0.280 10 03 0.278 Authority centrality
A node is authority-central to the extent that its in-links are from nodes that have many out-links. Individuals or organizations that act as authorities are receiving information from a wide range of others each of whom sends information to a large number of others. Technically, an agent is authority-central if its in-links are from agents that have are sending links to many others. The scientific name of this measure is authority centrality and it is calculated on agent by agent matrices.
Input network(s): agent x agent
Rank Agent Value 1 01 0.399 2 35 0.357 3 22 0.340 4 13 0.337 5 33 0.321 6 42 0.315 7 24 0.310 8 37 0.302 9 02 0.297 10 03 0.294 Information centrality
Calculate the Stephenson and Zelen information centrality measure for each node.
Input network(s): agent x agent
Rank Agent Value Unscaled 1 22 0.040 30.427 2 01 0.039 29.710 3 37 0.036 27.489 4 02 0.036 27.317 5 33 0.035 26.892 6 44 0.035 26.519 7 42 0.034 25.849 8 18 0.034 25.828 9 03 0.033 25.340 10 23 0.033 25.294 Clique membership count
The number of distinct cliques to which each node belongs. Individuals or organizations who are high in number of cliques are those that belong to a large number of distinct cliques. A clique is defined as a group of three or more actors that have many connections to each other and relatively fewer connections to those in other groups. The scientific name of this measure is clique count and it is calculated on the agent by agent matrices.
Input network(s): agent x agent
Rank Agent Value 1 01 120.000 2 22 114.000 3 24 106.000 4 33 106.000 5 23 90.000 6 03 88.000 7 19 86.000 8 27 86.000 9 42 77.000 10 08 69.000 Simmelian ties
The normalized number of Simmelian ties of each node.
Input network(s): agent x agent
Rank Agent Value Unscaled 1 01 0.702 33.000 2 22 0.617 29.000 3 33 0.532 25.000 4 02 0.489 23.000 5 06 0.489 23.000 6 32 0.489 23.000 7 42 0.489 23.000 8 03 0.468 22.000 9 13 0.447 21.000 10 18 0.447 21.000 Clustering coefficient
Measures the degree of clustering in a network by averaging the clustering coefficient of each node, which is defined as the density of the node's ego network.
Input network(s): agent x agent
Rank Agent Value 1 10 0.903 2 31 0.876 3 20 0.861 4 38 0.843 5 36 0.829 6 11 0.795 7 25 0.790 8 26 0.781 9 45 0.776 10 14 0.775
Key Nodes Table
This shows the top scoring nodes side-by-side for selected measures.
Rank Betweenness centrality Closeness centrality Eigenvector centrality Eigenvector centrality per component In-degree centrality In-Closeness centrality Out-degree centrality Total degree centrality 1 19 39 22 22 01 08 22 01 2 41 21 01 01 22 27 01 22 3 03 19 35 35 35 23 37 02 4 23 40 37 37 13 41 02 33 5 08 03 33 33 42 24 33 37 6 40 36 03 03 02 18 44 42 7 33 01 13 13 33 19 18 35 8 01 41 02 02 24 03 42 03 9 27 44 42 42 03 42 03 13 10 22 08 24 24 37 32 32 32