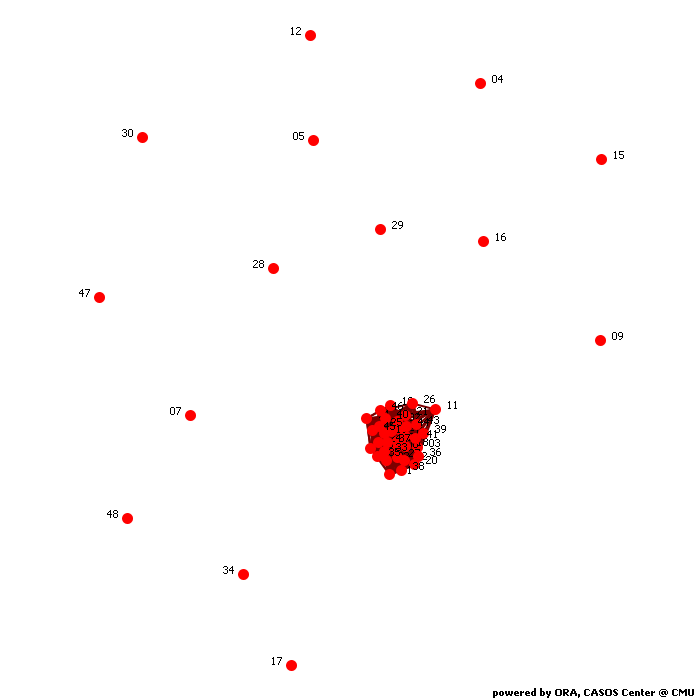
Calculates common social network measures on each selected input network.
Network agent x agent
Network Level Measures
Measure Value Row count 48.000 Column count 48.000 Link count 830.000 Density 0.368 Components of 1 node (isolates) 14 Components of 2 nodes (dyadic isolates) 0 Components of 3 or more nodes 1 Reciprocity 0.751 Characteristic path length 2.258 Clustering coefficient 0.563 Network levels (diameter) 4.000 Network fragmentation 0.503 Krackhardt connectedness 0.497 Krackhardt efficiency 0.165 Krackhardt hierarchy 0.000 Krackhardt upperboundedness 1.000 Degree centralization 0.276 Betweenness centralization 0.017 Closeness centralization 0.007 Eigenvector centralization 0.181 Reciprocal (symmetric)? No (75% of the links are reciprocal)
Node Level Measures
Measure Min Max Avg Stddev Total degree centrality 0.000 0.465 0.201 0.146 Total degree centrality [Unscaled] 0.000 175.000 75.542 54.961 In-degree centrality 0.000 0.511 0.201 0.150 In-degree centrality [Unscaled] 0.000 96.000 37.771 28.118 Out-degree centrality 0.000 0.457 0.201 0.147 Out-degree centrality [Unscaled] 0.000 86.000 37.771 27.546 Eigenvector centrality 0.000 0.341 0.168 0.116 Eigenvector centrality [Unscaled] 0.000 0.241 0.119 0.082 Eigenvector centrality per component 0.000 0.171 0.084 0.058 Closeness centrality 0.005 0.017 0.014 0.005 Closeness centrality [Unscaled] 0.000 0.000 0.000 0.000 In-Closeness centrality 0.005 0.017 0.014 0.005 In-Closeness centrality [Unscaled] 0.000 0.000 0.000 0.000 Betweenness centrality 0.000 0.022 0.006 0.006 Betweenness centrality [Unscaled] 0.000 47.337 12.316 14.025 Hub centrality 0.000 0.367 0.166 0.118 Authority centrality 0.000 0.391 0.165 0.120 Information centrality 0.000 0.038 0.021 0.014 Information centrality [Unscaled] 0.000 39.317 21.411 14.476 Clique membership count 0.000 71.000 25.479 24.698 Simmelian ties 0.000 0.702 0.316 0.234 Simmelian ties [Unscaled] 0.000 33.000 14.833 10.984 Clustering coefficient 0.000 0.877 0.563 0.363
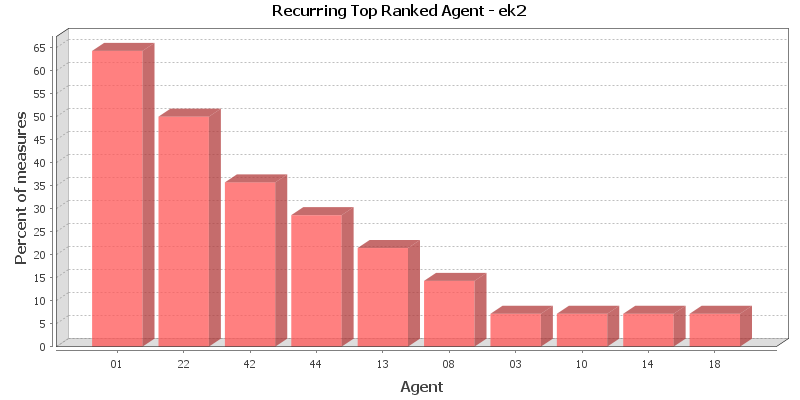
Key Nodes
This chart shows the Agent that is repeatedly top-ranked in the measures listed below. The value shown is the percentage of measures for which the Agent was ranked in the top three.
Total degree centrality
The Total Degree Centrality of a node is the normalized sum of its row and column degrees. Individuals or organizations who are "in the know" are those who are linked to many others and so, by virtue of their position have access to the ideas, thoughts, beliefs of many others. Individuals who are "in the know" are identified by degree centrality in the relevant social network. Those who are ranked high on this metrics have more connections to others in the same network. The scientific name of this measure is total degree centrality and it is calculated on the agent by agent matrices.
Input network: agent x agent (size: 48, density: 0.367908)
Rank Agent Value Unscaled Context* 1 01 0.465 175.000 1.401 2 22 0.412 155.000 0.637 3 42 0.396 149.000 0.408 4 44 0.396 149.000 0.408 5 13 0.380 143.000 0.178 6 37 0.378 142.000 0.140 7 02 0.364 137.000 -0.051 8 19 0.346 130.000 -0.318 9 06 0.338 127.000 -0.433 10 18 0.332 125.000 -0.509 * Number of standard deviations from the mean of a random network of the same size and density
Mean: 0.201 Mean in random network: 0.368 Std.dev: 0.146 Std.dev in random network: 0.070 In-degree centrality
The In Degree Centrality of a node is its normalized in-degree. For any node, e.g. an individual or a resource, the in-links are the connections that the node of interest receives from other nodes. For example, imagine an agent by knowledge matrix then the number of in-links a piece of knowledge has is the number of agents that are connected to. The scientific name of this measure is in-degree and it is calculated on the agent by agent matrices.
Input network(s): agent x agent
Rank Agent Value Unscaled 1 01 0.511 96.000 2 13 0.426 80.000 3 42 0.399 75.000 4 35 0.383 72.000 5 44 0.372 70.000 6 22 0.367 69.000 7 19 0.362 68.000 8 06 0.351 66.000 9 24 0.351 66.000 10 02 0.346 65.000 Out-degree centrality
For any node, e.g. an individual or a resource, the out-links are the connections that the node of interest sends to other nodes. For example, imagine an agent by knowledge matrix then the number of out-links an agent would have is the number of pieces of knowledge it is connected to. The scientific name of this measure is out-degree and it is calculated on the agent by agent matrices. Individuals or organizations who are high in most knowledge have more expertise or are associated with more types of knowledge than are others. If no sub-network connecting agents to knowledge exists, then this measure will not be calculated. The scientific name of this measure is out degree centrality and it is calculated on agent by knowledge matrices. Individuals or organizations who are high in "most resources" have more resources or are associated with more types of resources than are others. If no sub-network connecting agents to resources exists, then this measure will not be calculated. The scientific name of this measure is out degree centrality and it is calculated on agent by resource matrices.
Input network(s): agent x agent
Rank Agent Value Unscaled 1 22 0.457 86.000 2 01 0.420 79.000 3 44 0.420 79.000 4 37 0.410 77.000 5 42 0.394 74.000 6 02 0.383 72.000 7 13 0.335 63.000 8 18 0.330 62.000 9 19 0.330 62.000 10 06 0.324 61.000 Eigenvector centrality
Calculates the principal eigenvector of the network. A node is central to the extent that its neighbors are central. Leaders of strong cliques are individuals who or organizations who are collected to others that are themselves highly connected to each other. In other words, if you have a clique then the individual most connected to others in the clique and other cliques, is the leader of the clique. Individuals or organizations who are connected to many otherwise isolated individuals or organizations will have a much lower score in this measure then those that are connected to groups that have many connections themselves. The scientific name of this measure is eigenvector centrality and it is calculated on agent by agent matrices.
Input network: agent x agent (size: 48, density: 0.367908)
Rank Agent Value Unscaled Context* 1 01 0.341 0.241 -1.125 2 22 0.326 0.230 -1.175 3 42 0.304 0.215 -1.244 4 44 0.300 0.212 -1.258 5 37 0.296 0.209 -1.271 6 13 0.293 0.207 -1.280 7 35 0.278 0.197 -1.328 8 02 0.273 0.193 -1.346 9 06 0.271 0.192 -1.352 10 33 0.271 0.191 -1.352 * Number of standard deviations from the mean of a random network of the same size and density
Mean: 0.168 Mean in random network: 0.691 Std.dev: 0.116 Std.dev in random network: 0.311 Eigenvector centrality per component
Calculates the principal eigenvector of the network. A node is central to the extent that its neighbors are central. Each component is extracted as a separate network, Eigenvector Centrality is computed on it and scaled according to the component size. The scores are then combined into a single result vector.
Input network(s): agent x agent
Rank Agent Value 1 01 0.171 2 22 0.163 3 42 0.152 4 44 0.150 5 37 0.148 6 13 0.147 7 35 0.139 8 02 0.137 9 06 0.136 10 33 0.136 Closeness centrality
The average closeness of a node to the other nodes in a network (also called out-closeness). Loosely, Closeness is the inverse of the average distance in the network from the node to all other nodes.
Input network: agent x agent (size: 48, density: 0.367908)
Rank Agent Value Unscaled Context* 1 39 0.017 0.000 -20.716 2 25 0.017 0.000 -20.717 3 20 0.017 0.000 -20.717 4 03 0.017 0.000 -20.718 5 21 0.017 0.000 -20.718 6 13 0.017 0.000 -20.719 7 06 0.017 0.000 -20.719 8 18 0.017 0.000 -20.719 9 08 0.017 0.000 -20.719 10 36 0.017 0.000 -20.719 * Number of standard deviations from the mean of a random network of the same size and density
Mean: 0.014 Mean in random network: 0.615 Std.dev: 0.005 Std.dev in random network: 0.029 In-Closeness centrality
The average closeness of a node from the other nodes in a network. Loosely, Closeness is the inverse of the average distance in the network to the node and from all other nodes.
Input network(s): agent x agent
Rank Agent Value Unscaled 1 08 0.017 0.000 2 23 0.017 0.000 3 40 0.017 0.000 4 41 0.017 0.000 5 36 0.017 0.000 6 18 0.017 0.000 7 24 0.017 0.000 8 03 0.017 0.000 9 32 0.017 0.000 10 19 0.017 0.000 Betweenness centrality
The Betweenness Centrality of node v in a network is defined as: across all node pairs that have a shortest path containing v, the percentage that pass through v. Individuals or organizations that are potentially influential are positioned to broker connections between groups and to bring to bear the influence of one group on another or serve as a gatekeeper between groups. This agent occurs on many of the shortest paths between other agents. The scientific name of this measure is betweenness centrality and it is calculated on agent by agent matrices.
Input network: agent x agent (size: 48, density: 0.367908)
Rank Agent Value Unscaled Context* 1 08 0.022 47.337 0.540 2 03 0.021 45.074 0.414 3 36 0.019 41.685 0.224 4 20 0.017 37.030 -0.036 5 41 0.016 35.556 -0.118 6 31 0.015 31.532 -0.343 7 45 0.013 29.078 -0.480 8 21 0.012 26.998 -0.596 9 25 0.012 26.979 -0.597 10 18 0.012 26.933 -0.599 * Number of standard deviations from the mean of a random network of the same size and density
Mean: 0.006 Mean in random network: 0.017 Std.dev: 0.006 Std.dev in random network: 0.008 Hub centrality
A node is hub-central to the extent that its out-links are to nodes that have many in-links. Individuals or organizations that act as hubs are sending information to a wide range of others each of whom has many others reporting to them. Technically, an agent is hub-central if its out-links are to agents that have many other agents sending links to them. The scientific name of this measure is hub centrality and it is calculated on agent by agent matrices.
Input network(s): agent x agent
Rank Agent Value 1 22 0.367 2 37 0.327 3 44 0.322 4 42 0.319 5 01 0.316 6 02 0.302 7 19 0.270 8 45 0.269 9 13 0.267 10 18 0.261 Authority centrality
A node is authority-central to the extent that its in-links are from nodes that have many out-links. Individuals or organizations that act as authorities are receiving information from a wide range of others each of whom sends information to a large number of others. Technically, an agent is authority-central if its in-links are from agents that have are sending links to many others. The scientific name of this measure is authority centrality and it is calculated on agent by agent matrices.
Input network(s): agent x agent
Rank Agent Value 1 01 0.391 2 13 0.340 3 42 0.321 4 35 0.315 5 44 0.295 6 19 0.291 7 24 0.289 8 22 0.288 9 06 0.285 10 33 0.280 Information centrality
Calculate the Stephenson and Zelen information centrality measure for each node.
Input network(s): agent x agent
Rank Agent Value Unscaled 1 22 0.038 39.317 2 44 0.037 37.887 3 01 0.037 37.705 4 37 0.036 37.394 5 42 0.036 36.585 6 02 0.035 36.189 7 13 0.033 33.751 8 18 0.033 33.563 9 19 0.033 33.544 10 06 0.032 33.251 Clique membership count
The number of distinct cliques to which each node belongs. Individuals or organizations who are high in number of cliques are those that belong to a large number of distinct cliques. A clique is defined as a group of three or more actors that have many connections to each other and relatively fewer connections to those in other groups. The scientific name of this measure is clique count and it is calculated on the agent by agent matrices.
Input network(s): agent x agent
Rank Agent Value 1 01 71.000 2 18 71.000 3 44 71.000 4 06 67.000 5 22 67.000 6 37 67.000 7 42 67.000 8 13 64.000 9 24 61.000 10 41 54.000 Simmelian ties
The normalized number of Simmelian ties of each node.
Input network(s): agent x agent
Rank Agent Value Unscaled 1 01 0.702 33.000 2 13 0.660 31.000 3 22 0.617 29.000 4 02 0.596 28.000 5 37 0.596 28.000 6 42 0.596 28.000 7 06 0.574 27.000 8 19 0.574 27.000 9 24 0.574 27.000 10 18 0.553 26.000 Clustering coefficient
Measures the degree of clustering in a network by averaging the clustering coefficient of each node, which is defined as the density of the node's ego network.
Input network(s): agent x agent
Rank Agent Value 1 38 0.877 2 14 0.864 3 10 0.862 4 31 0.858 5 26 0.845 6 32 0.837 7 36 0.832 8 35 0.821 9 27 0.820 10 08 0.819
Key Nodes Table
This shows the top scoring nodes side-by-side for selected measures.
Rank Betweenness centrality Closeness centrality Eigenvector centrality Eigenvector centrality per component In-degree centrality In-Closeness centrality Out-degree centrality Total degree centrality 1 08 39 01 01 01 08 22 01 2 03 25 22 22 13 23 01 22 3 36 20 42 42 42 40 44 42 4 20 03 44 44 35 41 37 44 5 41 21 37 37 44 36 42 13 6 31 13 13 13 22 18 02 37 7 45 06 35 35 19 24 13 02 8 21 18 02 02 06 03 18 19 9 25 08 06 06 24 32 19 06 10 18 36 33 33 02 19 06 18