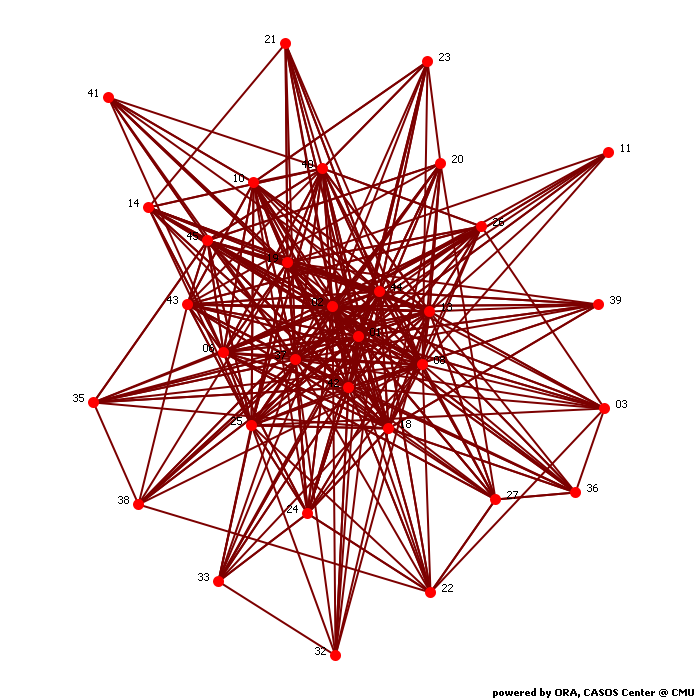
Calculates common social network measures on each selected input network.
Network agent x agent
Network Level Measures
Measure Value Row count 32.000 Column count 32.000 Link count 460.000 Density 0.449 Components of 1 node (isolates) 0 Components of 2 nodes (dyadic isolates) 0 Components of 3 or more nodes 1 Reciprocity 0.654 Characteristic path length 11.661 Clustering coefficient 0.712 Network levels (diameter) 29.000 Network fragmentation 0.000 Krackhardt connectedness 1.000 Krackhardt efficiency 0.452 Krackhardt hierarchy 0.000 Krackhardt upperboundedness 1.000 Degree centralization 0.143 Betweenness centralization 0.263 Closeness centralization 0.440 Eigenvector centralization 0.660 Reciprocal (symmetric)? No (65% of the links are reciprocal)
Node Level Measures
Measure Min Max Avg Stddev Total degree centrality 0.003 0.162 0.027 0.035 Total degree centrality [Unscaled] 105.000 5690.000 954.625 1231.166 In-degree centrality 0.005 0.141 0.027 0.030 In-degree centrality [Unscaled] 81.000 2519.000 484.813 536.247 Out-degree centrality 0.000 0.179 0.027 0.040 Out-degree centrality [Unscaled] 8.000 3195.000 484.813 711.228 Eigenvector centrality 0.027 0.787 0.168 0.185 Eigenvector centrality [Unscaled] 0.019 0.557 0.119 0.131 Eigenvector centrality per component 0.019 0.557 0.119 0.131 Closeness centrality 0.081 0.400 0.191 0.065 Closeness centrality [Unscaled] 0.001 0.006 0.003 0.001 In-Closeness centrality 0.135 0.202 0.173 0.017 In-Closeness centrality [Unscaled] 0.002 0.003 0.003 0.000 Betweenness centrality 0.000 0.300 0.045 0.059 Betweenness centrality [Unscaled] 0.000 279.117 41.913 54.875 Hub centrality 0.002 0.820 0.147 0.202 Authority centrality 0.030 0.747 0.175 0.178 Information centrality 0.006 0.046 0.031 0.012 Information centrality [Unscaled] 8.117 64.991 44.021 17.370 Clique membership count 1.000 33.000 10.063 10.971 Simmelian ties 0.000 0.935 0.349 0.241 Simmelian ties [Unscaled] 0.000 29.000 10.813 7.485 Clustering coefficient 0.415 0.969 0.712 0.160
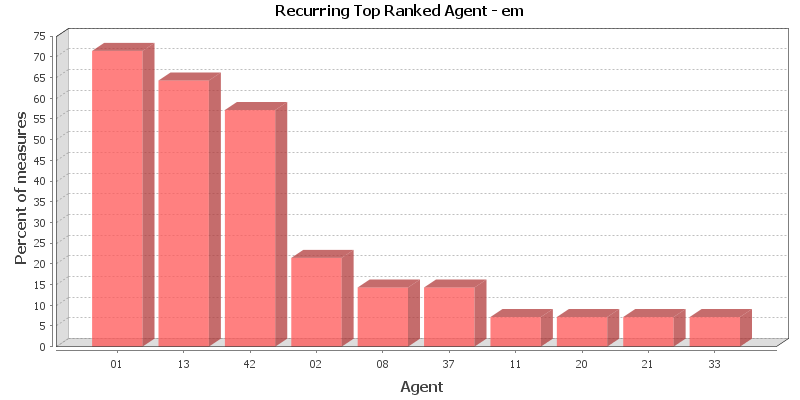
Key Nodes
This chart shows the Agent that is repeatedly top-ranked in the measures listed below. The value shown is the percentage of measures for which the Agent was ranked in the top three.
Total degree centrality
The Total Degree Centrality of a node is the normalized sum of its row and column degrees. Individuals or organizations who are "in the know" are those who are linked to many others and so, by virtue of their position have access to the ideas, thoughts, beliefs of many others. Individuals who are "in the know" are identified by degree centrality in the relevant social network. Those who are ranked high on this metrics have more connections to others in the same network. The scientific name of this measure is total degree centrality and it is calculated on the agent by agent matrices.
Input network: agent x agent (size: 32, density: 0.449219)
Rank Agent Value Unscaled Context* 1 01 0.162 5690.000 -3.271 2 42 0.102 3587.000 -3.950 3 13 0.085 2991.000 -4.143 4 02 0.066 2339.000 -4.353 5 45 0.062 2199.000 -4.399 6 44 0.062 2182.000 -4.404 7 19 0.045 1600.000 -4.592 8 37 0.037 1292.000 -4.692 9 18 0.021 737.000 -4.871 10 40 0.020 705.000 -4.881 * Number of standard deviations from the mean of a random network of the same size and density
Mean: 0.027 Mean in random network: 0.449 Std.dev: 0.035 Std.dev in random network: 0.088 In-degree centrality
The In Degree Centrality of a node is its normalized in-degree. For any node, e.g. an individual or a resource, the in-links are the connections that the node of interest receives from other nodes. For example, imagine an agent by knowledge matrix then the number of in-links a piece of knowledge has is the number of agents that are connected to. The scientific name of this measure is in-degree and it is calculated on the agent by agent matrices.
Input network(s): agent x agent
Rank Agent Value Unscaled 1 01 0.141 2519.000 2 13 0.078 1395.000 3 42 0.077 1379.000 4 02 0.068 1218.000 5 44 0.064 1138.000 6 45 0.064 1138.000 7 19 0.043 762.000 8 37 0.036 640.000 9 43 0.023 413.000 10 40 0.022 400.000 Out-degree centrality
For any node, e.g. an individual or a resource, the out-links are the connections that the node of interest sends to other nodes. For example, imagine an agent by knowledge matrix then the number of out-links an agent would have is the number of pieces of knowledge it is connected to. The scientific name of this measure is out-degree and it is calculated on the agent by agent matrices. Individuals or organizations who are high in most knowledge have more expertise or are associated with more types of knowledge than are others. If no sub-network connecting agents to knowledge exists, then this measure will not be calculated. The scientific name of this measure is out degree centrality and it is calculated on agent by knowledge matrices. Individuals or organizations who are high in "most resources" have more resources or are associated with more types of resources than are others. If no sub-network connecting agents to resources exists, then this measure will not be calculated. The scientific name of this measure is out degree centrality and it is calculated on agent by resource matrices.
Input network(s): agent x agent
Rank Agent Value Unscaled 1 01 0.179 3195.000 2 42 0.124 2214.000 3 13 0.090 1606.000 4 45 0.072 1280.000 5 02 0.063 1127.000 6 44 0.058 1044.000 7 19 0.048 867.000 8 37 0.037 657.000 9 18 0.020 365.000 10 06 0.019 335.000 Eigenvector centrality
Calculates the principal eigenvector of the network. A node is central to the extent that its neighbors are central. Leaders of strong cliques are individuals who or organizations who are collected to others that are themselves highly connected to each other. In other words, if you have a clique then the individual most connected to others in the clique and other cliques, is the leader of the clique. Individuals or organizations who are connected to many otherwise isolated individuals or organizations will have a much lower score in this measure then those that are connected to groups that have many connections themselves. The scientific name of this measure is eigenvector centrality and it is calculated on agent by agent matrices.
Input network: agent x agent (size: 32, density: 0.449219)
Rank Agent Value Unscaled Context* 1 01 0.787 0.557 0.302 2 42 0.578 0.409 -0.424 3 13 0.484 0.342 -0.751 4 02 0.466 0.330 -0.813 5 45 0.441 0.312 -0.901 6 44 0.335 0.237 -1.267 7 19 0.265 0.187 -1.512 8 37 0.225 0.159 -1.651 9 43 0.142 0.101 -1.938 10 40 0.137 0.097 -1.957 * Number of standard deviations from the mean of a random network of the same size and density
Mean: 0.168 Mean in random network: 0.700 Std.dev: 0.185 Std.dev in random network: 0.288 Eigenvector centrality per component
Calculates the principal eigenvector of the network. A node is central to the extent that its neighbors are central. Each component is extracted as a separate network, Eigenvector Centrality is computed on it and scaled according to the component size. The scores are then combined into a single result vector.
Input network(s): agent x agent
Rank Agent Value 1 01 0.557 2 42 0.409 3 13 0.342 4 02 0.330 5 45 0.312 6 44 0.237 7 19 0.187 8 37 0.159 9 43 0.101 10 40 0.097 Closeness centrality
The average closeness of a node to the other nodes in a network (also called out-closeness). Loosely, Closeness is the inverse of the average distance in the network from the node to all other nodes.
Input network: agent x agent (size: 32, density: 0.449219)
Rank Agent Value Unscaled Context* 1 08 0.400 0.006 -6.422 2 37 0.288 0.005 -9.328 3 13 0.287 0.005 -9.362 4 43 0.286 0.005 -9.397 5 45 0.276 0.004 -9.661 6 06 0.244 0.004 -10.480 7 10 0.238 0.004 -10.627 8 26 0.227 0.004 -10.922 9 25 0.221 0.004 -11.090 10 14 0.210 0.003 -11.363 * Number of standard deviations from the mean of a random network of the same size and density
Mean: 0.191 Mean in random network: 0.647 Std.dev: 0.065 Std.dev in random network: 0.038 In-Closeness centrality
The average closeness of a node from the other nodes in a network. Loosely, Closeness is the inverse of the average distance in the network to the node and from all other nodes.
Input network(s): agent x agent
Rank Agent Value Unscaled 1 02 0.202 0.003 2 33 0.201 0.003 3 20 0.194 0.003 4 26 0.194 0.003 5 03 0.192 0.003 6 44 0.190 0.003 7 10 0.189 0.003 8 06 0.186 0.003 9 01 0.186 0.003 10 08 0.183 0.003 Betweenness centrality
The Betweenness Centrality of node v in a network is defined as: across all node pairs that have a shortest path containing v, the percentage that pass through v. Individuals or organizations that are potentially influential are positioned to broker connections between groups and to bring to bear the influence of one group on another or serve as a gatekeeper between groups. This agent occurs on many of the shortest paths between other agents. The scientific name of this measure is betweenness centrality and it is calculated on agent by agent matrices.
Input network: agent x agent (size: 32, density: 0.449219)
Rank Agent Value Unscaled Context* 1 08 0.300 279.117 26.098 2 13 0.154 142.917 12.318 3 43 0.113 104.983 8.480 4 26 0.090 83.583 6.315 5 44 0.087 81.117 6.065 6 06 0.087 80.733 6.027 7 10 0.075 69.667 4.907 8 18 0.070 64.667 4.401 9 20 0.051 47.033 2.617 10 24 0.047 43.950 2.305 * Number of standard deviations from the mean of a random network of the same size and density
Mean: 0.045 Mean in random network: 0.023 Std.dev: 0.059 Std.dev in random network: 0.011 Hub centrality
A node is hub-central to the extent that its out-links are to nodes that have many in-links. Individuals or organizations that act as hubs are sending information to a wide range of others each of whom has many others reporting to them. Technically, an agent is hub-central if its out-links are to agents that have many other agents sending links to them. The scientific name of this measure is hub centrality and it is calculated on agent by agent matrices.
Input network(s): agent x agent
Rank Agent Value 1 01 0.820 2 42 0.677 3 45 0.478 4 13 0.477 5 02 0.369 6 19 0.298 7 44 0.257 8 37 0.186 9 23 0.114 10 43 0.112 Authority centrality
A node is authority-central to the extent that its in-links are from nodes that have many out-links. Individuals or organizations that act as authorities are receiving information from a wide range of others each of whom sends information to a large number of others. Technically, an agent is authority-central if its in-links are from agents that have are sending links to many others. The scientific name of this measure is authority centrality and it is calculated on agent by agent matrices.
Input network(s): agent x agent
Rank Agent Value 1 01 0.747 2 02 0.528 3 13 0.522 4 42 0.450 5 45 0.440 6 44 0.375 7 19 0.286 8 37 0.257 9 43 0.159 10 40 0.154 Information centrality
Calculate the Stephenson and Zelen information centrality measure for each node.
Input network(s): agent x agent
Rank Agent Value Unscaled 1 01 0.046 64.991 2 42 0.046 64.585 3 13 0.045 63.376 4 45 0.045 63.243 5 02 0.044 62.345 6 44 0.044 61.884 7 19 0.044 61.471 8 37 0.042 59.810 9 18 0.040 56.102 10 06 0.039 54.979 Clique membership count
The number of distinct cliques to which each node belongs. Individuals or organizations who are high in number of cliques are those that belong to a large number of distinct cliques. A clique is defined as a group of three or more actors that have many connections to each other and relatively fewer connections to those in other groups. The scientific name of this measure is clique count and it is calculated on the agent by agent matrices.
Input network(s): agent x agent
Rank Agent Value 1 01 33.000 2 02 33.000 3 37 33.000 4 44 33.000 5 08 28.000 6 42 26.000 7 13 19.000 8 18 14.000 9 25 13.000 10 06 11.000 Simmelian ties
The normalized number of Simmelian ties of each node.
Input network(s): agent x agent
Rank Agent Value Unscaled 1 01 0.935 29.000 2 44 0.839 26.000 3 42 0.774 24.000 4 02 0.677 21.000 5 13 0.645 20.000 6 06 0.548 17.000 7 19 0.548 17.000 8 45 0.548 17.000 9 18 0.516 16.000 10 37 0.452 14.000 Clustering coefficient
Measures the degree of clustering in a network by averaging the clustering coefficient of each node, which is defined as the density of the node's ego network.
Input network(s): agent x agent
Rank Agent Value 1 39 0.969 2 11 0.918 3 21 0.901 4 41 0.891 5 35 0.870 6 14 0.858 7 26 0.840 8 32 0.840 9 36 0.820 10 23 0.815
Key Nodes Table
This shows the top scoring nodes side-by-side for selected measures.
Rank Betweenness centrality Closeness centrality Eigenvector centrality Eigenvector centrality per component In-degree centrality In-Closeness centrality Out-degree centrality Total degree centrality 1 08 08 01 01 01 02 01 01 2 13 37 42 42 13 33 42 42 3 43 13 13 13 42 20 13 13 4 26 43 02 02 02 26 45 02 5 44 45 45 45 44 03 02 45 6 06 06 44 44 45 44 44 44 7 10 10 19 19 19 10 19 19 8 18 26 37 37 37 06 37 37 9 20 25 43 43 43 01 18 18 10 24 14 40 40 40 08 06 40