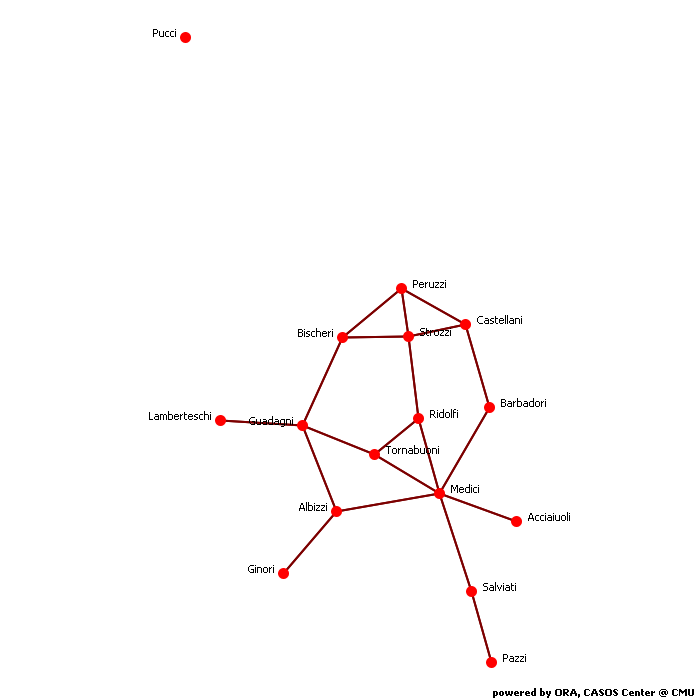
Calculates common social network measures on each selected input network.
Network agent x agent
Network Level Measures
Measure Value Row count 16.000 Column count 16.000 Link count 20.000 Density 0.167 Components of 1 node (isolates) 1 Components of 2 nodes (dyadic isolates) 0 Components of 3 or more nodes 1 Reciprocity 1.000 Characteristic path length 2.486 Clustering coefficient 0.150 Network levels (diameter) 5.000 Network fragmentation 0.125 Krackhardt connectedness 0.875 Krackhardt efficiency 0.934 Krackhardt hierarchy 0.000 Krackhardt upperboundedness 1.000 Degree centralization 0.267 Betweenness centralization 0.383 Closeness centralization 0.179 Eigenvector centralization 0.342 Reciprocal (symmetric)? Yes
Node Level Measures
Measure Min Max Avg Stddev Total degree centrality 0.000 0.400 0.167 0.097 Total degree centrality [Unscaled] 0.000 6.000 2.500 1.458 In-degree centrality 0.000 0.400 0.167 0.097 In-degree centrality [Unscaled] 0.000 6.000 2.500 1.458 Out-degree centrality 0.000 0.400 0.167 0.097 Out-degree centrality [Unscaled] 0.000 6.000 2.500 1.458 Eigenvector centrality 0.000 0.609 0.310 0.171 Eigenvector centrality [Unscaled] 0.000 0.430 0.219 0.121 Eigenvector centrality per component 0.000 0.403 0.205 0.113 Closeness centrality 0.063 0.366 0.285 0.067 Closeness centrality [Unscaled] 0.004 0.024 0.019 0.004 In-Closeness centrality 0.063 0.366 0.285 0.067 In-Closeness centrality [Unscaled] 0.004 0.024 0.019 0.004 Betweenness centrality 0.000 0.452 0.093 0.113 Betweenness centrality [Unscaled] 0.000 47.500 9.750 11.910 Hub centrality 0.000 0.609 0.310 0.171 Authority centrality 0.000 0.609 0.310 0.171 Information centrality 0.000 0.096 0.063 0.023 Information centrality [Unscaled] 0.000 1.118 0.726 0.269 Clique membership count 0.000 2.000 0.563 0.704 Simmelian ties 0.000 0.200 0.067 0.078 Simmelian ties [Unscaled] 0.000 3.000 1.000 1.173 Clustering coefficient 0.000 0.667 0.150 0.201
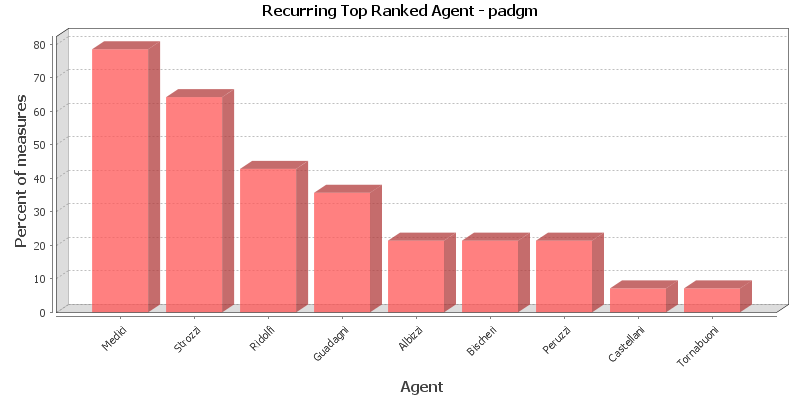
Key Nodes
This chart shows the Agent that is repeatedly top-ranked in the measures listed below. The value shown is the percentage of measures for which the Agent was ranked in the top three.
Total degree centrality
The Total Degree Centrality of a node is the normalized sum of its row and column degrees. Individuals or organizations who are "in the know" are those who are linked to many others and so, by virtue of their position have access to the ideas, thoughts, beliefs of many others. Individuals who are "in the know" are identified by degree centrality in the relevant social network. Those who are ranked high on this metrics have more connections to others in the same network. The scientific name of this measure is total degree centrality and it is calculated on the agent by agent matrices.
Input network: agent x agent (size: 16, density: 0.166667)
Rank Agent Value Unscaled Context* 1 Medici 0.400 6.000 2.504 2 Guadagni 0.267 4.000 1.073 3 Strozzi 0.267 4.000 1.073 4 Albizzi 0.200 3.000 0.358 5 Bischeri 0.200 3.000 0.358 6 Castellani 0.200 3.000 0.358 7 Peruzzi 0.200 3.000 0.358 8 Ridolfi 0.200 3.000 0.358 9 Tornabuoni 0.200 3.000 0.358 10 Barbadori 0.133 2.000 -0.358 * Number of standard deviations from the mean of a random network of the same size and density
Mean: 0.167 Mean in random network: 0.167 Std.dev: 0.097 Std.dev in random network: 0.093 In-degree centrality
The In Degree Centrality of a node is its normalized in-degree. For any node, e.g. an individual or a resource, the in-links are the connections that the node of interest receives from other nodes. For example, imagine an agent by knowledge matrix then the number of in-links a piece of knowledge has is the number of agents that are connected to. The scientific name of this measure is in-degree and it is calculated on the agent by agent matrices.
Input network(s): agent x agent
Rank Agent Value Unscaled 1 Medici 0.400 6.000 2 Guadagni 0.267 4.000 3 Strozzi 0.267 4.000 4 Albizzi 0.200 3.000 5 Bischeri 0.200 3.000 6 Castellani 0.200 3.000 7 Peruzzi 0.200 3.000 8 Ridolfi 0.200 3.000 9 Tornabuoni 0.200 3.000 10 Barbadori 0.133 2.000 Out-degree centrality
For any node, e.g. an individual or a resource, the out-links are the connections that the node of interest sends to other nodes. For example, imagine an agent by knowledge matrix then the number of out-links an agent would have is the number of pieces of knowledge it is connected to. The scientific name of this measure is out-degree and it is calculated on the agent by agent matrices. Individuals or organizations who are high in most knowledge have more expertise or are associated with more types of knowledge than are others. If no sub-network connecting agents to knowledge exists, then this measure will not be calculated. The scientific name of this measure is out degree centrality and it is calculated on agent by knowledge matrices. Individuals or organizations who are high in "most resources" have more resources or are associated with more types of resources than are others. If no sub-network connecting agents to resources exists, then this measure will not be calculated. The scientific name of this measure is out degree centrality and it is calculated on agent by resource matrices.
Input network(s): agent x agent
Rank Agent Value Unscaled 1 Medici 0.400 6.000 2 Guadagni 0.267 4.000 3 Strozzi 0.267 4.000 4 Albizzi 0.200 3.000 5 Bischeri 0.200 3.000 6 Castellani 0.200 3.000 7 Peruzzi 0.200 3.000 8 Ridolfi 0.200 3.000 9 Tornabuoni 0.200 3.000 10 Barbadori 0.133 2.000 Eigenvector centrality
Calculates the principal eigenvector of the network. A node is central to the extent that its neighbors are central. Leaders of strong cliques are individuals who or organizations who are collected to others that are themselves highly connected to each other. In other words, if you have a clique then the individual most connected to others in the clique and other cliques, is the leader of the clique. Individuals or organizations who are connected to many otherwise isolated individuals or organizations will have a much lower score in this measure then those that are connected to groups that have many connections themselves. The scientific name of this measure is eigenvector centrality and it is calculated on agent by agent matrices.
Input network: agent x agent (size: 16, density: 0.166667)
Rank Agent Value Unscaled Context* 1 Medici 0.609 0.430 0.598 2 Strozzi 0.503 0.356 0.277 3 Ridolfi 0.483 0.342 0.215 4 Tornabuoni 0.461 0.326 0.147 5 Guadagni 0.409 0.289 -0.011 6 Bischeri 0.400 0.283 -0.038 7 Peruzzi 0.390 0.276 -0.069 8 Castellani 0.366 0.259 -0.141 9 Albizzi 0.345 0.244 -0.206 10 Barbadori 0.299 0.212 -0.345 * Number of standard deviations from the mean of a random network of the same size and density
Mean: 0.310 Mean in random network: 0.413 Std.dev: 0.171 Std.dev in random network: 0.328 Eigenvector centrality per component
Calculates the principal eigenvector of the network. A node is central to the extent that its neighbors are central. Each component is extracted as a separate network, Eigenvector Centrality is computed on it and scaled according to the component size. The scores are then combined into a single result vector.
Input network(s): agent x agent
Rank Agent Value 1 Medici 0.403 2 Strozzi 0.334 3 Ridolfi 0.320 4 Tornabuoni 0.305 5 Guadagni 0.271 6 Bischeri 0.265 7 Peruzzi 0.258 8 Castellani 0.243 9 Albizzi 0.229 10 Barbadori 0.198 Closeness centrality
The average closeness of a node to the other nodes in a network (also called out-closeness). Loosely, Closeness is the inverse of the average distance in the network from the node to all other nodes.
Input network: agent x agent (size: 16, density: 0.166667)
Rank Agent Value Unscaled Context* 1 Medici 0.366 0.024 -0.070 2 Ridolfi 0.341 0.023 -0.532 3 Albizzi 0.333 0.022 -0.672 4 Tornabuoni 0.333 0.022 -0.672 5 Guadagni 0.326 0.022 -0.807 6 Barbadori 0.313 0.021 -1.058 7 Strozzi 0.313 0.021 -1.058 8 Bischeri 0.294 0.020 -1.399 9 Castellani 0.288 0.019 -1.504 10 Salviati 0.288 0.019 -1.504 * Number of standard deviations from the mean of a random network of the same size and density
Mean: 0.285 Mean in random network: 0.370 Std.dev: 0.067 Std.dev in random network: 0.054 In-Closeness centrality
The average closeness of a node from the other nodes in a network. Loosely, Closeness is the inverse of the average distance in the network to the node and from all other nodes.
Input network(s): agent x agent
Rank Agent Value Unscaled 1 Medici 0.366 0.024 2 Ridolfi 0.341 0.023 3 Albizzi 0.333 0.022 4 Tornabuoni 0.333 0.022 5 Guadagni 0.326 0.022 6 Barbadori 0.313 0.021 7 Strozzi 0.313 0.021 8 Bischeri 0.294 0.020 9 Castellani 0.288 0.019 10 Salviati 0.288 0.019 Betweenness centrality
The Betweenness Centrality of node v in a network is defined as: across all node pairs that have a shortest path containing v, the percentage that pass through v. Individuals or organizations that are potentially influential are positioned to broker connections between groups and to bring to bear the influence of one group on another or serve as a gatekeeper between groups. This agent occurs on many of the shortest paths between other agents. The scientific name of this measure is betweenness centrality and it is calculated on agent by agent matrices.
Input network: agent x agent (size: 16, density: 0.166667)
Rank Agent Value Unscaled Context* 1 Medici 0.452 47.500 4.975 2 Guadagni 0.221 23.167 1.674 3 Albizzi 0.184 19.333 1.154 4 Salviati 0.124 13.000 0.295 5 Ridolfi 0.098 10.333 -0.066 6 Bischeri 0.090 9.500 -0.179 7 Strozzi 0.089 9.333 -0.202 8 Barbadori 0.081 8.500 -0.315 9 Tornabuoni 0.079 8.333 -0.337 10 Castellani 0.048 5.000 -0.790 * Number of standard deviations from the mean of a random network of the same size and density
Mean: 0.093 Mean in random network: 0.103 Std.dev: 0.113 Std.dev in random network: 0.070 Hub centrality
A node is hub-central to the extent that its out-links are to nodes that have many in-links. Individuals or organizations that act as hubs are sending information to a wide range of others each of whom has many others reporting to them. Technically, an agent is hub-central if its out-links are to agents that have many other agents sending links to them. The scientific name of this measure is hub centrality and it is calculated on agent by agent matrices.
Input network(s): agent x agent
Rank Agent Value 1 Medici 0.609 2 Strozzi 0.503 3 Ridolfi 0.483 4 Tornabuoni 0.461 5 Guadagni 0.409 6 Bischeri 0.400 7 Peruzzi 0.390 8 Castellani 0.366 9 Albizzi 0.345 10 Barbadori 0.299 Authority centrality
A node is authority-central to the extent that its in-links are from nodes that have many out-links. Individuals or organizations that act as authorities are receiving information from a wide range of others each of whom sends information to a large number of others. Technically, an agent is authority-central if its in-links are from agents that have are sending links to many others. The scientific name of this measure is authority centrality and it is calculated on agent by agent matrices.
Input network(s): agent x agent
Rank Agent Value 1 Medici 0.609 2 Strozzi 0.503 3 Ridolfi 0.483 4 Tornabuoni 0.461 5 Guadagni 0.409 6 Bischeri 0.400 7 Peruzzi 0.390 8 Castellani 0.366 9 Albizzi 0.345 10 Barbadori 0.299 Information centrality
Calculate the Stephenson and Zelen information centrality measure for each node.
Input network(s): agent x agent
Rank Agent Value Unscaled 1 Medici 0.096 1.118 2 Guadagni 0.082 0.957 3 Tornabuoni 0.081 0.940 4 Ridolfi 0.081 0.939 5 Strozzi 0.079 0.914 6 Bischeri 0.074 0.864 7 Albizzi 0.074 0.862 8 Castellani 0.071 0.824 9 Peruzzi 0.069 0.807 10 Barbadori 0.068 0.791 Clique membership count
The number of distinct cliques to which each node belongs. Individuals or organizations who are high in number of cliques are those that belong to a large number of distinct cliques. A clique is defined as a group of three or more actors that have many connections to each other and relatively fewer connections to those in other groups. The scientific name of this measure is clique count and it is calculated on the agent by agent matrices.
Input network(s): agent x agent
Rank Agent Value 1 Peruzzi 2.000 2 Strozzi 2.000 3 Bischeri 1.000 4 Castellani 1.000 5 Medici 1.000 6 Ridolfi 1.000 7 Tornabuoni 1.000 Simmelian ties
The normalized number of Simmelian ties of each node.
Input network(s): agent x agent
Rank Agent Value Unscaled 1 Peruzzi 0.200 3.000 2 Strozzi 0.200 3.000 3 Bischeri 0.133 2.000 4 Castellani 0.133 2.000 5 Medici 0.133 2.000 6 Ridolfi 0.133 2.000 7 Tornabuoni 0.133 2.000 Clustering coefficient
Measures the degree of clustering in a network by averaging the clustering coefficient of each node, which is defined as the density of the node's ego network.
Input network(s): agent x agent
Rank Agent Value 1 Peruzzi 0.667 2 Bischeri 0.333 3 Castellani 0.333 4 Ridolfi 0.333 5 Strozzi 0.333 6 Tornabuoni 0.333 7 Medici 0.067
Key Nodes Table
This shows the top scoring nodes side-by-side for selected measures.
Rank Betweenness centrality Closeness centrality Eigenvector centrality Eigenvector centrality per component In-degree centrality In-Closeness centrality Out-degree centrality Total degree centrality 1 Medici Medici Medici Medici Medici Medici Medici Medici 2 Guadagni Ridolfi Strozzi Strozzi Guadagni Ridolfi Guadagni Guadagni 3 Albizzi Albizzi Ridolfi Ridolfi Strozzi Albizzi Strozzi Strozzi 4 Salviati Tornabuoni Tornabuoni Tornabuoni Albizzi Tornabuoni Albizzi Albizzi 5 Ridolfi Guadagni Guadagni Guadagni Bischeri Guadagni Bischeri Bischeri 6 Bischeri Barbadori Bischeri Bischeri Castellani Barbadori Castellani Castellani 7 Strozzi Strozzi Peruzzi Peruzzi Peruzzi Strozzi Peruzzi Peruzzi 8 Barbadori Bischeri Castellani Castellani Ridolfi Bischeri Ridolfi Ridolfi 9 Tornabuoni Castellani Albizzi Albizzi Tornabuoni Castellani Tornabuoni Tornabuoni 10 Castellani Salviati Barbadori Barbadori Barbadori Salviati Barbadori Barbadori