Calculates common social network measures on each selected input network.
Network agent x agent
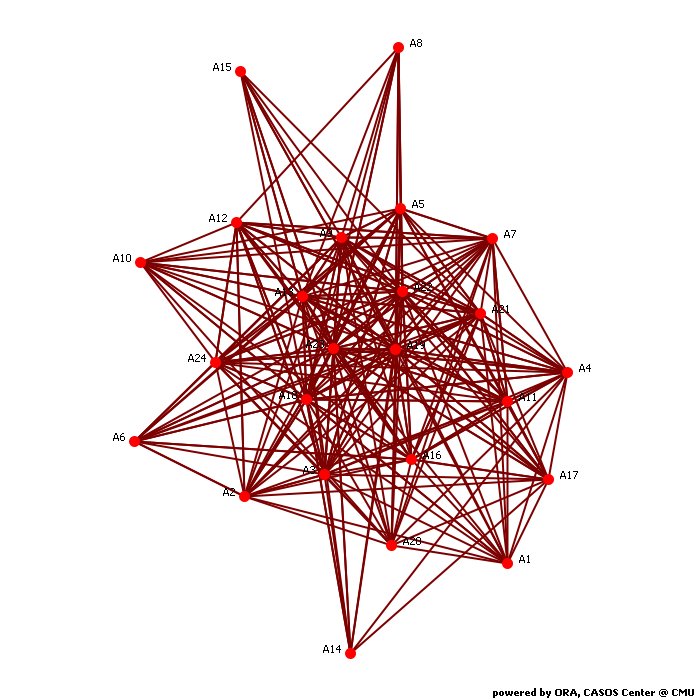
Network Level Measures
Measure Value Row count 24.000 Column count 24.000 Link count 307.000 Density 0.556 Components of 1 node (isolates) 0 Components of 2 nodes (dyadic isolates) 0 Components of 3 or more nodes 1 Reciprocity 0.527 Characteristic path length 1.467 Clustering coefficient 0.690 Network levels (diameter) 3.000 Network fragmentation 0.000 Krackhardt connectedness 1.000 Krackhardt efficiency 0.296 Krackhardt hierarchy 0.000 Krackhardt upperboundedness 1.000 Degree centralization 0.437 Betweenness centralization 0.087 Closeness centralization 0.619 Eigenvector centralization 0.085 Reciprocal (symmetric)? No (52% of the links are reciprocal)
Node Level Measures
Measure Min Max Avg Stddev Total degree centrality 0.217 0.957 0.556 0.210 Total degree centrality [Unscaled] 10.000 44.000 25.583 9.669 In-degree centrality 0.130 0.913 0.556 0.237 In-degree centrality [Unscaled] 3.000 21.000 12.792 5.447 Out-degree centrality 0.043 1.000 0.556 0.260 Out-degree centrality [Unscaled] 1.000 23.000 12.792 5.972 Eigenvector centrality 0.136 0.359 0.281 0.065 Eigenvector centrality [Unscaled] 0.096 0.254 0.199 0.046 Eigenvector centrality per component 0.096 0.254 0.199 0.046 Closeness centrality 0.434 1.000 0.710 0.140 Closeness centrality [Unscaled] 0.019 0.043 0.031 0.006 In-Closeness centrality 0.511 0.920 0.703 0.124 In-Closeness centrality [Unscaled] 0.022 0.040 0.031 0.005 Betweenness centrality 0.000 0.105 0.021 0.030 Betweenness centrality [Unscaled] 0.000 52.922 10.750 15.109 Hub centrality 0.025 0.409 0.267 0.109 Authority centrality 0.080 0.399 0.271 0.099 Information centrality 0.012 0.054 0.042 0.011 Information centrality [Unscaled] 1.421 6.502 5.023 1.325 Clique membership count 1.000 51.000 22.292 15.805 Simmelian ties 0.000 0.913 0.380 0.243 Simmelian ties [Unscaled] 0.000 21.000 8.750 5.599 Clustering coefficient 0.520 1.000 0.690 0.131
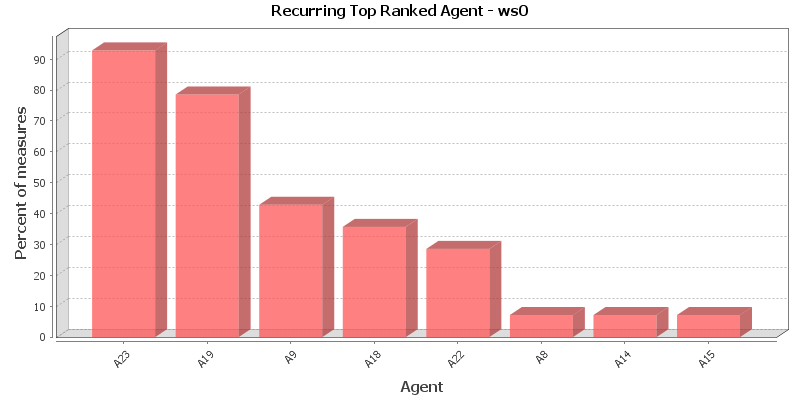
Key Nodes
This chart shows the Agent that is repeatedly top-ranked in the measures listed below. The value shown is the percentage of measures for which the Agent was ranked in the top three.
Total degree centrality
The Total Degree Centrality of a node is the normalized sum of its row and column degrees. Individuals or organizations who are "in the know" are those who are linked to many others and so, by virtue of their position have access to the ideas, thoughts, beliefs of many others. Individuals who are "in the know" are identified by degree centrality in the relevant social network. Those who are ranked high on this metrics have more connections to others in the same network. The scientific name of this measure is total degree centrality and it is calculated on the agent by agent matrices.
Input network: agent x agent (size: 24, density: 0.556159)
Rank Agent Value Unscaled Context* 1 A23 0.957 44.000 3.948 2 A19 0.891 41.000 3.305 3 A18 0.870 40.000 3.090 4 A22 0.848 39.000 2.876 5 A13 0.783 36.000 2.233 6 A9 0.717 33.000 1.590 7 A21 0.652 30.000 0.947 8 A3 0.609 28.000 0.518 9 A5 0.609 28.000 0.518 10 A16 0.609 28.000 0.518 * Number of standard deviations from the mean of a random network of the same size and density
Mean: 0.556 Mean in random network: 0.556 Std.dev: 0.210 Std.dev in random network: 0.101 In-degree centrality
The In Degree Centrality of a node is its normalized in-degree. For any node, e.g. an individual or a resource, the in-links are the connections that the node of interest receives from other nodes. For example, imagine an agent by knowledge matrix then the number of in-links a piece of knowledge has is the number of agents that are connected to. The scientific name of this measure is in-degree and it is calculated on the agent by agent matrices.
Input network(s): agent x agent
Rank Agent Value Unscaled 1 A23 0.913 21.000 2 A9 0.870 20.000 3 A18 0.870 20.000 4 A19 0.870 20.000 5 A13 0.826 19.000 6 A22 0.783 18.000 7 A5 0.739 17.000 8 A7 0.739 17.000 9 A1 0.652 15.000 10 A20 0.609 14.000 Out-degree centrality
For any node, e.g. an individual or a resource, the out-links are the connections that the node of interest sends to other nodes. For example, imagine an agent by knowledge matrix then the number of out-links an agent would have is the number of pieces of knowledge it is connected to. The scientific name of this measure is out-degree and it is calculated on the agent by agent matrices. Individuals or organizations who are high in most knowledge have more expertise or are associated with more types of knowledge than are others. If no sub-network connecting agents to knowledge exists, then this measure will not be calculated. The scientific name of this measure is out degree centrality and it is calculated on agent by knowledge matrices. Individuals or organizations who are high in "most resources" have more resources or are associated with more types of resources than are others. If no sub-network connecting agents to resources exists, then this measure will not be calculated. The scientific name of this measure is out degree centrality and it is calculated on agent by resource matrices.
Input network(s): agent x agent
Rank Agent Value Unscaled 1 A23 1.000 23.000 2 A19 0.913 21.000 3 A22 0.913 21.000 4 A18 0.870 20.000 5 A3 0.826 19.000 6 A2 0.739 17.000 7 A13 0.739 17.000 8 A21 0.739 17.000 9 A4 0.652 15.000 10 A16 0.652 15.000 Eigenvector centrality
Calculates the principal eigenvector of the network. A node is central to the extent that its neighbors are central. Leaders of strong cliques are individuals who or organizations who are collected to others that are themselves highly connected to each other. In other words, if you have a clique then the individual most connected to others in the clique and other cliques, is the leader of the clique. Individuals or organizations who are connected to many otherwise isolated individuals or organizations will have a much lower score in this measure then those that are connected to groups that have many connections themselves. The scientific name of this measure is eigenvector centrality and it is calculated on agent by agent matrices.
Input network: agent x agent (size: 24, density: 0.556159)
Rank Agent Value Unscaled Context* 1 A19 0.359 0.254 -1.380 2 A23 0.359 0.254 -1.380 3 A9 0.351 0.248 -1.409 4 A18 0.345 0.244 -1.430 5 A13 0.345 0.244 -1.432 6 A22 0.343 0.243 -1.437 7 A3 0.332 0.235 -1.478 8 A21 0.316 0.224 -1.536 9 A7 0.310 0.219 -1.557 10 A16 0.304 0.215 -1.579 * Number of standard deviations from the mean of a random network of the same size and density
Mean: 0.281 Mean in random network: 0.736 Std.dev: 0.065 Std.dev in random network: 0.273 Eigenvector centrality per component
Calculates the principal eigenvector of the network. A node is central to the extent that its neighbors are central. Each component is extracted as a separate network, Eigenvector Centrality is computed on it and scaled according to the component size. The scores are then combined into a single result vector.
Input network(s): agent x agent
Rank Agent Value 1 A19 0.254 2 A23 0.254 3 A9 0.248 4 A18 0.244 5 A13 0.244 6 A22 0.243 7 A3 0.235 8 A21 0.224 9 A7 0.219 10 A16 0.215 Closeness centrality
The average closeness of a node to the other nodes in a network (also called out-closeness). Loosely, Closeness is the inverse of the average distance in the network from the node to all other nodes.
Input network: agent x agent (size: 24, density: 0.556159)
Rank Agent Value Unscaled Context* 1 A23 1.000 0.043 7.132 2 A19 0.920 0.040 5.299 3 A22 0.920 0.040 5.299 4 A18 0.885 0.038 4.488 5 A3 0.852 0.037 3.738 6 A2 0.793 0.034 2.392 7 A13 0.793 0.034 2.392 8 A21 0.793 0.034 2.392 9 A4 0.742 0.032 1.220 10 A16 0.742 0.032 1.220 * Number of standard deviations from the mean of a random network of the same size and density
Mean: 0.710 Mean in random network: 0.689 Std.dev: 0.140 Std.dev in random network: 0.044 In-Closeness centrality
The average closeness of a node from the other nodes in a network. Loosely, Closeness is the inverse of the average distance in the network to the node and from all other nodes.
Input network(s): agent x agent
Rank Agent Value Unscaled 1 A23 0.920 0.040 2 A9 0.885 0.038 3 A18 0.885 0.038 4 A19 0.885 0.038 5 A13 0.852 0.037 6 A22 0.821 0.036 7 A5 0.793 0.034 8 A7 0.793 0.034 9 A1 0.742 0.032 10 A20 0.719 0.031 Betweenness centrality
The Betweenness Centrality of node v in a network is defined as: across all node pairs that have a shortest path containing v, the percentage that pass through v. Individuals or organizations that are potentially influential are positioned to broker connections between groups and to bring to bear the influence of one group on another or serve as a gatekeeper between groups. This agent occurs on many of the shortest paths between other agents. The scientific name of this measure is betweenness centrality and it is calculated on agent by agent matrices.
Input network: agent x agent (size: 24, density: 0.556159)
Rank Agent Value Unscaled Context* 1 A18 0.105 52.922 7.182 2 A23 0.104 52.771 7.156 3 A19 0.065 32.819 3.729 4 A22 0.053 27.044 2.737 5 A13 0.036 18.256 1.228 6 A17 0.025 12.744 0.281 7 A7 0.019 9.677 -0.245 8 A9 0.015 7.743 -0.578 9 A16 0.014 7.016 -0.703 10 A21 0.014 6.974 -0.710 * Number of standard deviations from the mean of a random network of the same size and density
Mean: 0.021 Mean in random network: 0.022 Std.dev: 0.030 Std.dev in random network: 0.012 Hub centrality
A node is hub-central to the extent that its out-links are to nodes that have many in-links. Individuals or organizations that act as hubs are sending information to a wide range of others each of whom has many others reporting to them. Technically, an agent is hub-central if its out-links are to agents that have many other agents sending links to them. The scientific name of this measure is hub centrality and it is calculated on agent by agent matrices.
Input network(s): agent x agent
Rank Agent Value 1 A23 0.409 2 A22 0.394 3 A19 0.393 4 A3 0.392 5 A18 0.380 6 A2 0.352 7 A21 0.350 8 A13 0.335 9 A4 0.330 10 A11 0.312 Authority centrality
A node is authority-central to the extent that its in-links are from nodes that have many out-links. Individuals or organizations that act as authorities are receiving information from a wide range of others each of whom sends information to a large number of others. Technically, an agent is authority-central if its in-links are from agents that have are sending links to many others. The scientific name of this measure is authority centrality and it is calculated on agent by agent matrices.
Input network(s): agent x agent
Rank Agent Value 1 A9 0.399 2 A23 0.396 3 A19 0.392 4 A13 0.384 5 A18 0.373 6 A22 0.360 7 A7 0.358 8 A5 0.356 9 A20 0.316 10 A1 0.312 Information centrality
Calculate the Stephenson and Zelen information centrality measure for each node.
Input network(s): agent x agent
Rank Agent Value Unscaled 1 A23 0.054 6.502 2 A19 0.053 6.352 3 A22 0.053 6.346 4 A18 0.052 6.258 5 A3 0.051 6.162 6 A21 0.049 5.940 7 A2 0.049 5.931 8 A13 0.049 5.930 9 A4 0.047 5.700 10 A16 0.047 5.696 Clique membership count
The number of distinct cliques to which each node belongs. Individuals or organizations who are high in number of cliques are those that belong to a large number of distinct cliques. A clique is defined as a group of three or more actors that have many connections to each other and relatively fewer connections to those in other groups. The scientific name of this measure is clique count and it is calculated on the agent by agent matrices.
Input network(s): agent x agent
Rank Agent Value 1 A19 51.000 2 A23 51.000 3 A9 49.000 4 A3 44.000 5 A13 39.000 6 A18 38.000 7 A21 31.000 8 A22 30.000 9 A7 28.000 10 A16 22.000 Simmelian ties
The normalized number of Simmelian ties of each node.
Input network(s): agent x agent
Rank Agent Value Unscaled 1 A23 0.913 21.000 2 A19 0.783 18.000 3 A18 0.739 17.000 4 A22 0.739 17.000 5 A13 0.609 14.000 6 A9 0.478 11.000 7 A11 0.478 11.000 8 A12 0.478 11.000 9 A21 0.478 11.000 10 A5 0.435 10.000 Clustering coefficient
Measures the degree of clustering in a network by averaging the clustering coefficient of each node, which is defined as the density of the node's ego network.
Input network(s): agent x agent
Rank Agent Value 1 A15 1.000 2 A8 0.964 3 A14 0.893 4 A6 0.848 5 A10 0.811 6 A11 0.742 7 A1 0.738 8 A12 0.714 9 A20 0.706 10 A7 0.703
Key Nodes Table
This shows the top scoring nodes side-by-side for selected measures.
Rank Betweenness centrality Closeness centrality Eigenvector centrality Eigenvector centrality per component In-degree centrality In-Closeness centrality Out-degree centrality Total degree centrality 1 A18 A23 A19 A19 A23 A23 A23 A23 2 A23 A19 A23 A23 A9 A9 A19 A19 3 A19 A22 A9 A9 A18 A18 A22 A18 4 A22 A18 A18 A18 A19 A19 A18 A22 5 A13 A3 A13 A13 A13 A13 A3 A13 6 A17 A2 A22 A22 A22 A22 A2 A9 7 A7 A13 A3 A3 A5 A5 A13 A21 8 A9 A21 A21 A21 A7 A7 A21 A3 9 A16 A4 A7 A7 A1 A1 A4 A5 10 A21 A16 A16 A16 A20 A20 A16 A16