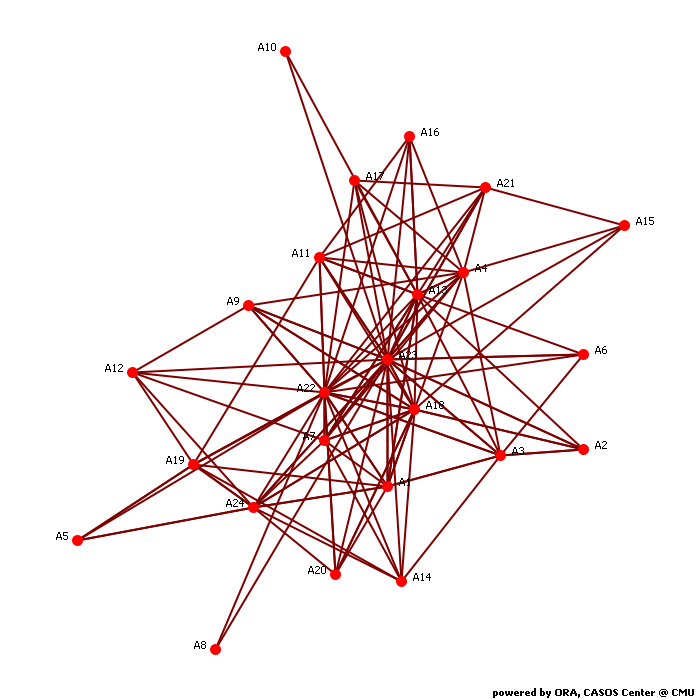
Calculates common social network measures on each selected input network.
Network agent x agent
Network Level Measures
Measure Value Row count 24.000 Column count 24.000 Link count 135.000 Density 0.245 Components of 1 node (isolates) 0 Components of 2 nodes (dyadic isolates) 0 Components of 3 or more nodes 1 Reciprocity 0.392 Characteristic path length 1.888 Clustering coefficient 0.599 Network levels (diameter) 4.000 Network fragmentation 0.000 Krackhardt connectedness 1.000 Krackhardt efficiency 0.708 Krackhardt hierarchy 0.231 Krackhardt upperboundedness 1.000 Degree centralization 0.563 Betweenness centralization 0.286 Closeness centralization 0.983 Eigenvector centralization 0.311 Reciprocal (symmetric)? No (39% of the links are reciprocal)
Node Level Measures
Measure Min Max Avg Stddev Total degree centrality 0.043 0.761 0.245 0.176 Total degree centrality [Unscaled] 2.000 35.000 11.250 8.089 In-degree centrality 0.087 0.565 0.245 0.115 In-degree centrality [Unscaled] 2.000 13.000 5.625 2.643 Out-degree centrality 0.000 0.957 0.245 0.256 Out-degree centrality [Unscaled] 0.000 22.000 5.625 5.887 Eigenvector centrality 0.092 0.548 0.263 0.119 Eigenvector centrality [Unscaled] 0.065 0.388 0.186 0.084 Eigenvector centrality per component 0.065 0.388 0.186 0.084 Closeness centrality 0.042 0.958 0.498 0.220 Closeness centrality [Unscaled] 0.002 0.042 0.022 0.010 In-Closeness centrality 0.197 0.253 0.216 0.014 In-Closeness centrality [Unscaled] 0.009 0.011 0.009 0.001 Betweenness centrality 0.000 0.310 0.035 0.068 Betweenness centrality [Unscaled] 0.000 156.789 17.875 34.266 Hub centrality 0.000 0.720 0.207 0.201 Authority centrality 0.129 0.448 0.277 0.081 Information centrality 0.000 0.075 0.042 0.023 Information centrality [Unscaled] 0.000 2.871 1.594 0.879 Clique membership count 1.000 27.000 5.750 6.654 Simmelian ties 0.000 0.478 0.123 0.131 Simmelian ties [Unscaled] 0.000 11.000 2.833 3.009 Clustering coefficient 0.206 1.000 0.599 0.222
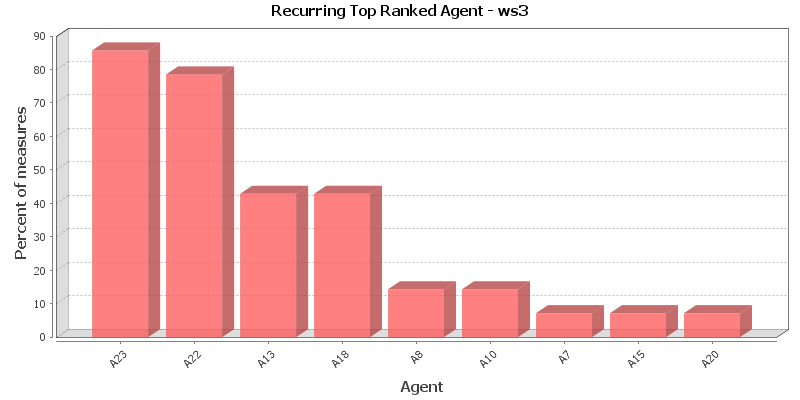
Key Nodes
This chart shows the Agent that is repeatedly top-ranked in the measures listed below. The value shown is the percentage of measures for which the Agent was ranked in the top three.
Total degree centrality
The Total Degree Centrality of a node is the normalized sum of its row and column degrees. Individuals or organizations who are "in the know" are those who are linked to many others and so, by virtue of their position have access to the ideas, thoughts, beliefs of many others. Individuals who are "in the know" are identified by degree centrality in the relevant social network. Those who are ranked high on this metrics have more connections to others in the same network. The scientific name of this measure is total degree centrality and it is calculated on the agent by agent matrices.
Input network: agent x agent (size: 24, density: 0.244565)
Rank Agent Value Unscaled Context* 1 A23 0.761 35.000 5.885 2 A22 0.630 29.000 4.398 3 A18 0.478 22.000 2.664 4 A13 0.435 20.000 2.168 5 A1 0.326 15.000 0.929 6 A24 0.326 15.000 0.929 7 A4 0.304 14.000 0.681 8 A7 0.283 13.000 0.434 9 A3 0.261 12.000 0.186 10 A11 0.239 11.000 -0.062 * Number of standard deviations from the mean of a random network of the same size and density
Mean: 0.245 Mean in random network: 0.245 Std.dev: 0.176 Std.dev in random network: 0.088 In-degree centrality
The In Degree Centrality of a node is its normalized in-degree. For any node, e.g. an individual or a resource, the in-links are the connections that the node of interest receives from other nodes. For example, imagine an agent by knowledge matrix then the number of in-links a piece of knowledge has is the number of agents that are connected to. The scientific name of this measure is in-degree and it is calculated on the agent by agent matrices.
Input network(s): agent x agent
Rank Agent Value Unscaled 1 A23 0.565 13.000 2 A18 0.478 11.000 3 A22 0.435 10.000 4 A7 0.348 8.000 5 A24 0.348 8.000 6 A1 0.261 6.000 7 A3 0.261 6.000 8 A13 0.261 6.000 9 A21 0.261 6.000 10 A11 0.217 5.000 Out-degree centrality
For any node, e.g. an individual or a resource, the out-links are the connections that the node of interest sends to other nodes. For example, imagine an agent by knowledge matrix then the number of out-links an agent would have is the number of pieces of knowledge it is connected to. The scientific name of this measure is out-degree and it is calculated on the agent by agent matrices. Individuals or organizations who are high in most knowledge have more expertise or are associated with more types of knowledge than are others. If no sub-network connecting agents to knowledge exists, then this measure will not be calculated. The scientific name of this measure is out degree centrality and it is calculated on agent by knowledge matrices. Individuals or organizations who are high in "most resources" have more resources or are associated with more types of resources than are others. If no sub-network connecting agents to resources exists, then this measure will not be calculated. The scientific name of this measure is out degree centrality and it is calculated on agent by resource matrices.
Input network(s): agent x agent
Rank Agent Value Unscaled 1 A23 0.957 22.000 2 A22 0.826 19.000 3 A13 0.609 14.000 4 A4 0.478 11.000 5 A18 0.478 11.000 6 A1 0.391 9.000 7 A24 0.304 7.000 8 A3 0.261 6.000 9 A11 0.261 6.000 10 A19 0.261 6.000 Eigenvector centrality
Calculates the principal eigenvector of the network. A node is central to the extent that its neighbors are central. Leaders of strong cliques are individuals who or organizations who are collected to others that are themselves highly connected to each other. In other words, if you have a clique then the individual most connected to others in the clique and other cliques, is the leader of the clique. Individuals or organizations who are connected to many otherwise isolated individuals or organizations will have a much lower score in this measure then those that are connected to groups that have many connections themselves. The scientific name of this measure is eigenvector centrality and it is calculated on agent by agent matrices.
Input network: agent x agent (size: 24, density: 0.244565)
Rank Agent Value Unscaled Context* 1 A23 0.548 0.388 0.026 2 A22 0.522 0.369 -0.067 3 A18 0.413 0.292 -0.449 4 A13 0.401 0.284 -0.492 5 A4 0.368 0.260 -0.609 6 A7 0.322 0.228 -0.770 7 A1 0.312 0.221 -0.806 8 A24 0.303 0.214 -0.837 9 A11 0.285 0.202 -0.899 10 A3 0.264 0.187 -0.973 * Number of standard deviations from the mean of a random network of the same size and density
Mean: 0.263 Mean in random network: 0.541 Std.dev: 0.119 Std.dev in random network: 0.284 Eigenvector centrality per component
Calculates the principal eigenvector of the network. A node is central to the extent that its neighbors are central. Each component is extracted as a separate network, Eigenvector Centrality is computed on it and scaled according to the component size. The scores are then combined into a single result vector.
Input network(s): agent x agent
Rank Agent Value 1 A23 0.388 2 A22 0.369 3 A18 0.292 4 A13 0.284 5 A4 0.260 6 A7 0.228 7 A1 0.221 8 A24 0.214 9 A11 0.202 10 A3 0.187 Closeness centrality
The average closeness of a node to the other nodes in a network (also called out-closeness). Loosely, Closeness is the inverse of the average distance in the network from the node to all other nodes.
Input network: agent x agent (size: 24, density: 0.244565)
Rank Agent Value Unscaled Context* 1 A23 0.958 0.042 8.190 2 A22 0.852 0.037 6.254 3 A13 0.719 0.031 3.834 4 A18 0.657 0.029 2.714 5 A4 0.639 0.028 2.382 6 A1 0.622 0.027 2.068 7 A24 0.590 0.026 1.488 8 A3 0.575 0.025 1.220 9 A11 0.575 0.025 1.220 10 A7 0.561 0.024 0.965 * Number of standard deviations from the mean of a random network of the same size and density
Mean: 0.498 Mean in random network: 0.508 Std.dev: 0.220 Std.dev in random network: 0.055 In-Closeness centrality
The average closeness of a node from the other nodes in a network. Loosely, Closeness is the inverse of the average distance in the network to the node and from all other nodes.
Input network(s): agent x agent
Rank Agent Value Unscaled 1 A15 0.253 0.011 2 A8 0.247 0.011 3 A10 0.245 0.011 4 A23 0.232 0.010 5 A18 0.225 0.010 6 A22 0.223 0.010 7 A7 0.217 0.009 8 A24 0.217 0.009 9 A1 0.213 0.009 10 A12 0.211 0.009 Betweenness centrality
The Betweenness Centrality of node v in a network is defined as: across all node pairs that have a shortest path containing v, the percentage that pass through v. Individuals or organizations that are potentially influential are positioned to broker connections between groups and to bring to bear the influence of one group on another or serve as a gatekeeper between groups. This agent occurs on many of the shortest paths between other agents. The scientific name of this measure is betweenness centrality and it is calculated on agent by agent matrices.
Input network: agent x agent (size: 24, density: 0.244565)
Rank Agent Value Unscaled Context* 1 A23 0.310 156.789 7.844 2 A22 0.149 75.282 2.913 3 A13 0.074 37.692 0.638 4 A7 0.069 34.680 0.456 5 A18 0.068 34.176 0.425 6 A24 0.063 31.816 0.283 7 A21 0.046 23.306 -0.232 8 A19 0.024 11.953 -0.919 9 A1 0.014 7.165 -1.209 10 A11 0.011 5.387 -1.316 * Number of standard deviations from the mean of a random network of the same size and density
Mean: 0.035 Mean in random network: 0.054 Std.dev: 0.068 Std.dev in random network: 0.033 Hub centrality
A node is hub-central to the extent that its out-links are to nodes that have many in-links. Individuals or organizations that act as hubs are sending information to a wide range of others each of whom has many others reporting to them. Technically, an agent is hub-central if its out-links are to agents that have many other agents sending links to them. The scientific name of this measure is hub centrality and it is calculated on agent by agent matrices.
Input network(s): agent x agent
Rank Agent Value 1 A23 0.720 2 A22 0.650 3 A13 0.514 4 A4 0.414 5 A18 0.397 6 A1 0.360 7 A11 0.248 8 A24 0.248 9 A3 0.220 10 A7 0.214 Authority centrality
A node is authority-central to the extent that its in-links are from nodes that have many out-links. Individuals or organizations that act as authorities are receiving information from a wide range of others each of whom sends information to a large number of others. Technically, an agent is authority-central if its in-links are from agents that have are sending links to many others. The scientific name of this measure is authority centrality and it is calculated on agent by agent matrices.
Input network(s): agent x agent
Rank Agent Value 1 A18 0.448 2 A23 0.439 3 A7 0.376 4 A22 0.371 5 A3 0.331 6 A1 0.325 7 A17 0.319 8 A24 0.317 9 A21 0.305 10 A16 0.301 Information centrality
Calculate the Stephenson and Zelen information centrality measure for each node.
Input network(s): agent x agent
Rank Agent Value Unscaled 1 A23 0.075 2.871 2 A22 0.074 2.823 3 A13 0.070 2.664 4 A4 0.067 2.552 5 A18 0.066 2.519 6 A1 0.063 2.409 7 A24 0.058 2.206 8 A11 0.056 2.156 9 A3 0.056 2.126 10 A19 0.055 2.093 Clique membership count
The number of distinct cliques to which each node belongs. Individuals or organizations who are high in number of cliques are those that belong to a large number of distinct cliques. A clique is defined as a group of three or more actors that have many connections to each other and relatively fewer connections to those in other groups. The scientific name of this measure is clique count and it is calculated on the agent by agent matrices.
Input network(s): agent x agent
Rank Agent Value 1 A23 27.000 2 A22 23.000 3 A13 13.000 4 A4 10.000 5 A18 10.000 6 A24 8.000 7 A1 5.000 8 A3 5.000 9 A7 5.000 10 A19 5.000 Simmelian ties
The normalized number of Simmelian ties of each node.
Input network(s): agent x agent
Rank Agent Value Unscaled 1 A23 0.478 11.000 2 A18 0.348 8.000 3 A22 0.348 8.000 4 A1 0.261 6.000 5 A13 0.217 5.000 6 A24 0.217 5.000 7 A3 0.174 4.000 8 A7 0.174 4.000 9 A2 0.130 3.000 10 A9 0.130 3.000 Clustering coefficient
Measures the degree of clustering in a network by averaging the clustering coefficient of each node, which is defined as the density of the node's ego network.
Input network(s): agent x agent
Rank Agent Value 1 A8 1.000 2 A10 1.000 3 A20 0.950 4 A16 0.850 5 A5 0.833 6 A6 0.833 7 A17 0.700 8 A2 0.667 9 A15 0.667 10 A14 0.643
Key Nodes Table
This shows the top scoring nodes side-by-side for selected measures.
Rank Betweenness centrality Closeness centrality Eigenvector centrality Eigenvector centrality per component In-degree centrality In-Closeness centrality Out-degree centrality Total degree centrality 1 A23 A23 A23 A23 A23 A15 A23 A23 2 A22 A22 A22 A22 A18 A8 A22 A22 3 A13 A13 A18 A18 A22 A10 A13 A18 4 A7 A18 A13 A13 A7 A23 A4 A13 5 A18 A4 A4 A4 A24 A18 A18 A1 6 A24 A1 A7 A7 A1 A22 A1 A24 7 A21 A24 A1 A1 A3 A7 A24 A4 8 A19 A3 A24 A24 A13 A24 A3 A7 9 A1 A11 A11 A11 A21 A1 A11 A3 10 A11 A7 A3 A3 A11 A12 A19 A11