Calculates common social network measures on each selected input network.
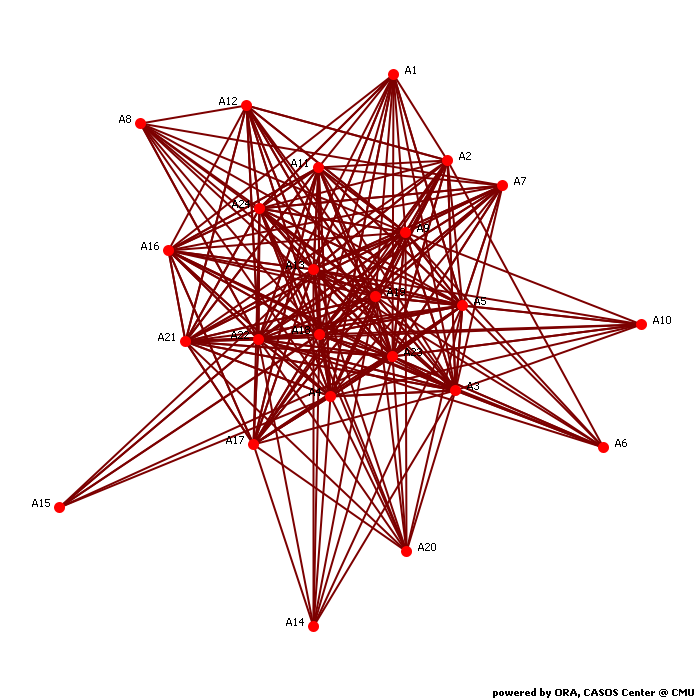
Network agent x agent
Network Level Measures
Measure Value Row count 24.000 Column count 24.000 Link count 310.000 Density 0.562 Components of 1 node (isolates) 0 Components of 2 nodes (dyadic isolates) 0 Components of 3 or more nodes 1 Reciprocity 0.590 Characteristic path length 1.389 Clustering coefficient 0.762 Network levels (diameter) 3.000 Network fragmentation 0.000 Krackhardt connectedness 1.000 Krackhardt efficiency 0.320 Krackhardt hierarchy 0.160 Krackhardt upperboundedness 1.000 Degree centralization 0.360 Betweenness centralization 0.077 Closeness centralization 0.634 Eigenvector centralization 0.089 Reciprocal (symmetric)? No (58% of the links are reciprocal)
Node Level Measures
Measure Min Max Avg Stddev Total degree centrality 0.152 0.891 0.562 0.240 Total degree centrality [Unscaled] 7.000 41.000 25.833 11.048 In-degree centrality 0.261 0.783 0.562 0.133 In-degree centrality [Unscaled] 6.000 18.000 12.917 3.068 Out-degree centrality 0.000 1.000 0.562 0.368 Out-degree centrality [Unscaled] 0.000 23.000 12.917 8.460 Eigenvector centrality 0.121 0.362 0.280 0.071 Eigenvector centrality [Unscaled] 0.086 0.256 0.198 0.050 Eigenvector centrality per component 0.086 0.256 0.198 0.050 Closeness centrality 0.042 1.000 0.703 0.262 Closeness centrality [Unscaled] 0.002 0.043 0.031 0.011 In-Closeness centrality 0.274 0.411 0.308 0.030 In-Closeness centrality [Unscaled] 0.012 0.018 0.013 0.001 Betweenness centrality 0.000 0.090 0.016 0.024 Betweenness centrality [Unscaled] 0.000 45.717 8.208 12.367 Hub centrality 0.000 0.416 0.244 0.154 Authority centrality 0.155 0.340 0.285 0.049 Information centrality 0.000 0.058 0.042 0.020 Information centrality [Unscaled] 0.000 5.080 3.640 1.711 Clique membership count 1.000 15.000 6.833 5.249 Simmelian ties 0.000 0.739 0.406 0.262 Simmelian ties [Unscaled] 0.000 17.000 9.333 6.032 Clustering coefficient 0.532 1.000 0.762 0.171
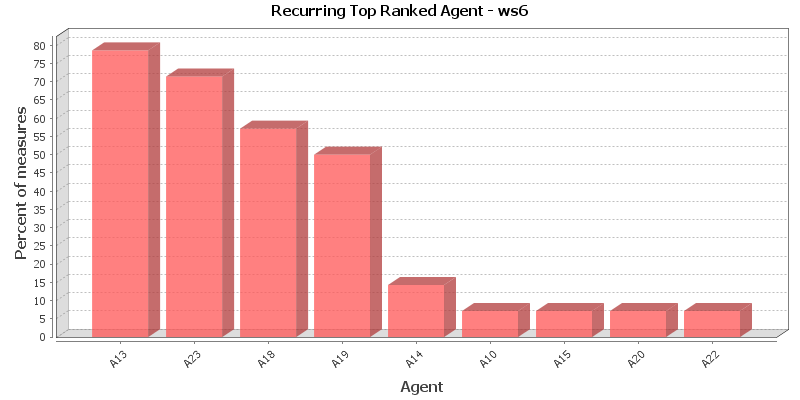
Key Nodes
This chart shows the Agent that is repeatedly top-ranked in the measures listed below. The value shown is the percentage of measures for which the Agent was ranked in the top three.
Total degree centrality
The Total Degree Centrality of a node is the normalized sum of its row and column degrees. Individuals or organizations who are "in the know" are those who are linked to many others and so, by virtue of their position have access to the ideas, thoughts, beliefs of many others. Individuals who are "in the know" are identified by degree centrality in the relevant social network. Those who are ranked high on this metrics have more connections to others in the same network. The scientific name of this measure is total degree centrality and it is calculated on the agent by agent matrices.
Input network: agent x agent (size: 24, density: 0.561594)
Rank Agent Value Unscaled Context* 1 A23 0.891 41.000 3.255 2 A13 0.870 40.000 3.041 3 A18 0.848 39.000 2.826 4 A22 0.848 39.000 2.826 5 A19 0.826 38.000 2.611 6 A4 0.783 36.000 2.182 7 A9 0.783 36.000 2.182 8 A5 0.739 34.000 1.753 9 A24 0.717 33.000 1.538 10 A3 0.696 32.000 1.324 * Number of standard deviations from the mean of a random network of the same size and density
Mean: 0.562 Mean in random network: 0.562 Std.dev: 0.240 Std.dev in random network: 0.101 In-degree centrality
The In Degree Centrality of a node is its normalized in-degree. For any node, e.g. an individual or a resource, the in-links are the connections that the node of interest receives from other nodes. For example, imagine an agent by knowledge matrix then the number of in-links a piece of knowledge has is the number of agents that are connected to. The scientific name of this measure is in-degree and it is calculated on the agent by agent matrices.
Input network(s): agent x agent
Rank Agent Value Unscaled 1 A23 0.783 18.000 2 A13 0.739 17.000 3 A18 0.739 17.000 4 A22 0.739 17.000 5 A4 0.652 15.000 6 A9 0.652 15.000 7 A19 0.652 15.000 8 A21 0.652 15.000 9 A24 0.652 15.000 10 A11 0.609 14.000 Out-degree centrality
For any node, e.g. an individual or a resource, the out-links are the connections that the node of interest sends to other nodes. For example, imagine an agent by knowledge matrix then the number of out-links an agent would have is the number of pieces of knowledge it is connected to. The scientific name of this measure is out-degree and it is calculated on the agent by agent matrices. Individuals or organizations who are high in most knowledge have more expertise or are associated with more types of knowledge than are others. If no sub-network connecting agents to knowledge exists, then this measure will not be calculated. The scientific name of this measure is out degree centrality and it is calculated on agent by knowledge matrices. Individuals or organizations who are high in "most resources" have more resources or are associated with more types of resources than are others. If no sub-network connecting agents to resources exists, then this measure will not be calculated. The scientific name of this measure is out degree centrality and it is calculated on agent by resource matrices.
Input network(s): agent x agent
Rank Agent Value Unscaled 1 A13 1.000 23.000 2 A19 1.000 23.000 3 A23 1.000 23.000 4 A18 0.957 22.000 5 A22 0.957 22.000 6 A3 0.913 21.000 7 A4 0.913 21.000 8 A5 0.913 21.000 9 A9 0.913 21.000 10 A24 0.783 18.000 Eigenvector centrality
Calculates the principal eigenvector of the network. A node is central to the extent that its neighbors are central. Leaders of strong cliques are individuals who or organizations who are collected to others that are themselves highly connected to each other. In other words, if you have a clique then the individual most connected to others in the clique and other cliques, is the leader of the clique. Individuals or organizations who are connected to many otherwise isolated individuals or organizations will have a much lower score in this measure then those that are connected to groups that have many connections themselves. The scientific name of this measure is eigenvector centrality and it is calculated on agent by agent matrices.
Input network: agent x agent (size: 24, density: 0.561594)
Rank Agent Value Unscaled Context* 1 A13 0.362 0.256 -1.381 2 A18 0.362 0.256 -1.381 3 A19 0.362 0.256 -1.381 4 A23 0.362 0.256 -1.381 5 A22 0.347 0.246 -1.433 6 A9 0.346 0.244 -1.439 7 A3 0.344 0.243 -1.445 8 A5 0.343 0.243 -1.448 9 A4 0.340 0.241 -1.459 10 A24 0.326 0.231 -1.510 * Number of standard deviations from the mean of a random network of the same size and density
Mean: 0.280 Mean in random network: 0.739 Std.dev: 0.071 Std.dev in random network: 0.273 Eigenvector centrality per component
Calculates the principal eigenvector of the network. A node is central to the extent that its neighbors are central. Each component is extracted as a separate network, Eigenvector Centrality is computed on it and scaled according to the component size. The scores are then combined into a single result vector.
Input network(s): agent x agent
Rank Agent Value 1 A13 0.256 2 A18 0.256 3 A19 0.256 4 A23 0.256 5 A22 0.246 6 A9 0.244 7 A3 0.243 8 A5 0.243 9 A4 0.241 10 A24 0.231 Closeness centrality
The average closeness of a node to the other nodes in a network (also called out-closeness). Loosely, Closeness is the inverse of the average distance in the network from the node to all other nodes.
Input network: agent x agent (size: 24, density: 0.561594)
Rank Agent Value Unscaled Context* 1 A13 1.000 0.043 7.109 2 A19 1.000 0.043 7.109 3 A23 1.000 0.043 7.109 4 A18 0.958 0.042 6.151 5 A22 0.958 0.042 6.151 6 A3 0.920 0.040 5.270 7 A4 0.920 0.040 5.270 8 A5 0.920 0.040 5.270 9 A9 0.920 0.040 5.270 10 A24 0.821 0.036 3.003 * Number of standard deviations from the mean of a random network of the same size and density
Mean: 0.703 Mean in random network: 0.691 Std.dev: 0.262 Std.dev in random network: 0.043 In-Closeness centrality
The average closeness of a node from the other nodes in a network. Loosely, Closeness is the inverse of the average distance in the network to the node and from all other nodes.
Input network(s): agent x agent
Rank Agent Value Unscaled 1 A20 0.411 0.018 2 A14 0.390 0.017 3 A23 0.319 0.014 4 A13 0.315 0.014 5 A18 0.315 0.014 6 A22 0.315 0.014 7 A4 0.307 0.013 8 A9 0.307 0.013 9 A19 0.307 0.013 10 A21 0.307 0.013 Betweenness centrality
The Betweenness Centrality of node v in a network is defined as: across all node pairs that have a shortest path containing v, the percentage that pass through v. Individuals or organizations that are potentially influential are positioned to broker connections between groups and to bring to bear the influence of one group on another or serve as a gatekeeper between groups. This agent occurs on many of the shortest paths between other agents. The scientific name of this measure is betweenness centrality and it is calculated on agent by agent matrices.
Input network: agent x agent (size: 24, density: 0.561594)
Rank Agent Value Unscaled Context* 1 A23 0.090 45.717 6.118 2 A22 0.083 42.034 5.472 3 A18 0.044 22.305 2.008 4 A13 0.036 17.967 1.246 5 A4 0.023 11.824 0.167 6 A3 0.023 11.793 0.162 7 A19 0.020 10.276 -0.105 8 A5 0.018 9.247 -0.285 9 A24 0.016 8.234 -0.463 10 A9 0.015 7.513 -0.590 * Number of standard deviations from the mean of a random network of the same size and density
Mean: 0.016 Mean in random network: 0.021 Std.dev: 0.024 Std.dev in random network: 0.011 Hub centrality
A node is hub-central to the extent that its out-links are to nodes that have many in-links. Individuals or organizations that act as hubs are sending information to a wide range of others each of whom has many others reporting to them. Technically, an agent is hub-central if its out-links are to agents that have many other agents sending links to them. The scientific name of this measure is hub centrality and it is calculated on agent by agent matrices.
Input network(s): agent x agent
Rank Agent Value 1 A19 0.416 2 A23 0.415 3 A13 0.414 4 A22 0.400 5 A18 0.400 6 A3 0.396 7 A5 0.393 8 A9 0.391 9 A4 0.387 10 A24 0.348 Authority centrality
A node is authority-central to the extent that its in-links are from nodes that have many out-links. Individuals or organizations that act as authorities are receiving information from a wide range of others each of whom sends information to a large number of others. Technically, an agent is authority-central if its in-links are from agents that have are sending links to many others. The scientific name of this measure is authority centrality and it is calculated on agent by agent matrices.
Input network(s): agent x agent
Rank Agent Value 1 A13 0.340 2 A23 0.338 3 A18 0.338 4 A21 0.332 5 A22 0.323 6 A9 0.322 7 A19 0.320 8 A17 0.319 9 A16 0.319 10 A11 0.318 Information centrality
Calculate the Stephenson and Zelen information centrality measure for each node.
Input network(s): agent x agent
Rank Agent Value Unscaled 1 A13 0.058 5.080 2 A19 0.058 5.080 3 A23 0.058 5.080 4 A18 0.058 5.046 5 A22 0.058 5.030 6 A4 0.057 4.973 7 A9 0.057 4.966 8 A5 0.057 4.964 9 A3 0.057 4.959 10 A24 0.054 4.750 Clique membership count
The number of distinct cliques to which each node belongs. Individuals or organizations who are high in number of cliques are those that belong to a large number of distinct cliques. A clique is defined as a group of three or more actors that have many connections to each other and relatively fewer connections to those in other groups. The scientific name of this measure is clique count and it is calculated on the agent by agent matrices.
Input network(s): agent x agent
Rank Agent Value 1 A13 15.000 2 A18 15.000 3 A19 15.000 4 A23 15.000 5 A9 13.000 6 A3 12.000 7 A5 11.000 8 A22 11.000 9 A4 10.000 10 A24 10.000 Simmelian ties
The normalized number of Simmelian ties of each node.
Input network(s): agent x agent
Rank Agent Value Unscaled 1 A13 0.739 17.000 2 A23 0.739 17.000 3 A18 0.696 16.000 4 A4 0.652 15.000 5 A9 0.652 15.000 6 A19 0.652 15.000 7 A22 0.652 15.000 8 A24 0.609 14.000 9 A5 0.565 13.000 10 A21 0.565 13.000 Clustering coefficient
Measures the degree of clustering in a network by averaging the clustering coefficient of each node, which is defined as the density of the node's ego network.
Input network(s): agent x agent
Rank Agent Value 1 A10 1.000 2 A15 1.000 3 A14 0.986 4 A20 0.970 5 A6 0.958 6 A8 0.936 7 A1 0.917 8 A7 0.872 9 A16 0.842 10 A11 0.837
Key Nodes Table
This shows the top scoring nodes side-by-side for selected measures.
Rank Betweenness centrality Closeness centrality Eigenvector centrality Eigenvector centrality per component In-degree centrality In-Closeness centrality Out-degree centrality Total degree centrality 1 A23 A13 A13 A13 A23 A20 A13 A23 2 A22 A19 A18 A18 A13 A14 A19 A13 3 A18 A23 A19 A19 A18 A23 A23 A18 4 A13 A18 A23 A23 A22 A13 A18 A22 5 A4 A22 A22 A22 A4 A18 A22 A19 6 A3 A3 A9 A9 A9 A22 A3 A4 7 A19 A4 A3 A3 A19 A4 A4 A9 8 A5 A5 A5 A5 A21 A9 A5 A5 9 A24 A9 A4 A4 A24 A19 A9 A24 10 A9 A24 A24 A24 A11 A21 A24 A3