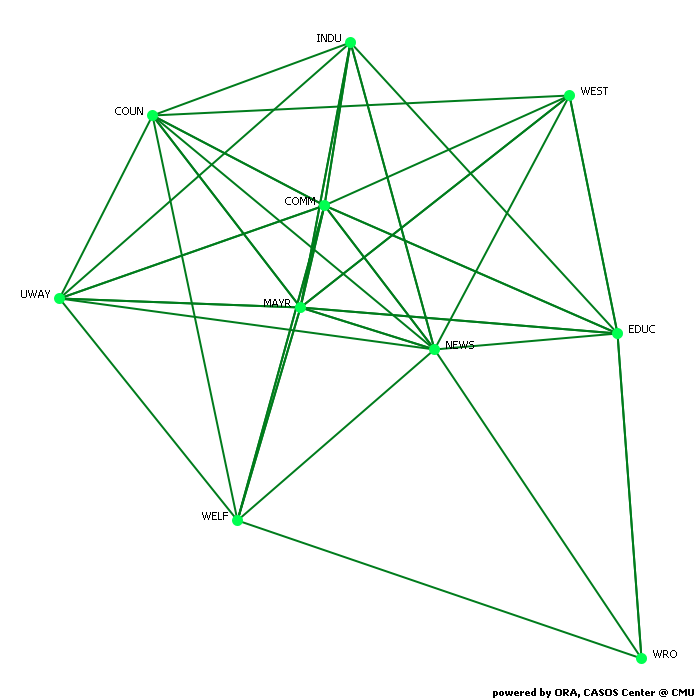
Network Level Measures
Measure Value Row count 10.000 Column count 10.000 Link count 49.000 Density 0.544 Components of 1 node (isolates) 0 Components of 2 nodes (dyadic isolates) 0 Components of 3 or more nodes 1 Reciprocity 0.531 Characteristic path length 1.533 Clustering coefficient 0.607 Network levels (diameter) 3.000 Network fragmentation 0.000 Krackhardt connectedness 1.000 Krackhardt efficiency 0.361 Krackhardt hierarchy 0.000 Krackhardt upperboundedness 1.000 Degree centralization 0.431 Betweenness centralization 0.201 Closeness centralization 0.541 Eigenvector centralization 0.157 Reciprocal (symmetric)? No (53% of the links are reciprocal)
Node Level Measures
Measure Min Max Avg Stddev Total degree centrality 0.222 0.889 0.544 0.192 Total degree centrality [Unscaled] 4.000 16.000 9.800 3.458 In-degree centrality 0.111 1.000 0.544 0.292 In-degree centrality [Unscaled] 1.000 9.000 4.900 2.625 Out-degree centrality 0.333 0.889 0.544 0.189 Out-degree centrality [Unscaled] 3.000 8.000 4.900 1.700 Eigenvector centrality 0.201 0.561 0.436 0.100 Eigenvector centrality [Unscaled] 0.142 0.397 0.308 0.071 Eigenvector centrality per component 0.142 0.397 0.308 0.071 Closeness centrality 0.529 0.900 0.671 0.116 Closeness centrality [Unscaled] 0.059 0.100 0.075 0.013 In-Closeness centrality 0.409 1.000 0.697 0.176 In-Closeness centrality [Unscaled] 0.045 0.111 0.077 0.020 Betweenness centrality 0.000 0.248 0.067 0.086 Betweenness centrality [Unscaled] 0.000 17.833 4.800 6.220 Hub centrality 0.253 0.581 0.434 0.108 Authority centrality 0.080 0.708 0.401 0.197 Information centrality 0.076 0.125 0.100 0.016 Information centrality [Unscaled] 2.063 3.407 2.718 0.426 Clique membership count 2.000 7.000 3.300 1.676 Simmelian ties 0.000 0.889 0.356 0.257 Simmelian ties [Unscaled] 0.000 8.000 3.200 2.315 Clustering coefficient 0.333 0.800 0.607 0.139
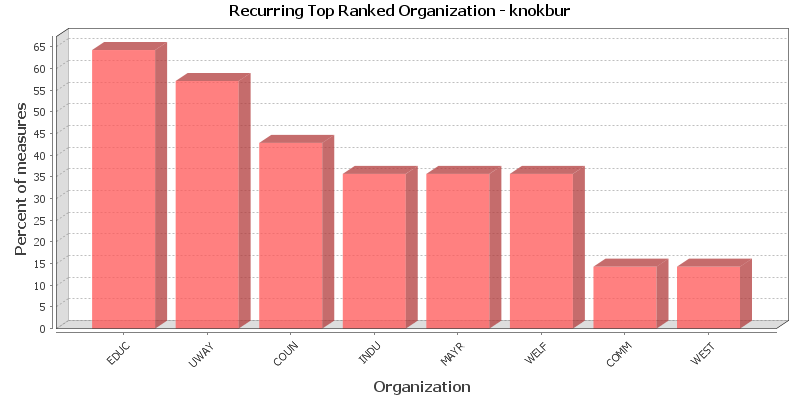
Key Nodes
This chart shows the Organization that is repeatedly top-ranked in the measures listed below. The value shown is the percentage of measures for which the Organization was ranked in the top three.
Total degree centrality
The Total Degree Centrality of a node is the normalized sum of its row and column degrees. Individuals or organizations who are "in the know" are those who are linked to many others and so, by virtue of their position have access to the ideas, thoughts, beliefs of many others. Individuals who are "in the know" are identified by degree centrality in the relevant social network. Those who are ranked high on this metrics have more connections to others in the same network. The scientific name of this measure is total degree centrality and it is calculated on the agent by agent matrices.
Input network: KNOKI (size: 10, density: 0.544444)
Rank Organization Value Unscaled Context* 1 MAYR 0.889 16.000 2.187 2 COMM 0.833 15.000 1.834 3 NEWS 0.667 12.000 0.776 4 EDUC 0.556 10.000 0.071 5 COUN 0.500 9.000 -0.282 6 INDU 0.500 9.000 -0.282 7 UWAY 0.444 8.000 -0.635 8 WELF 0.444 8.000 -0.635 9 WEST 0.389 7.000 -0.988 10 WRO 0.222 4.000 -2.046 * Number of standard deviations from the mean of a random network of the same size and density
Mean: 0.544 Mean in random network: 0.544 Std.dev: 0.192 Std.dev in random network: 0.157 In-degree centrality
The In Degree Centrality of a node is its normalized in-degree. For any node, e.g. an individual or a resource, the in-links are the connections that the node of interest receives from other nodes. For example, imagine an agent by knowledge matrix then the number of in-links a piece of knowledge has is the number of agents that are connected to. The scientific name of this measure is in-degree and it is calculated on the agent by agent matrices.
Input network(s): KNOKI
Rank Organization Value Unscaled 1 NEWS 1.000 9.000 2 COMM 0.889 8.000 3 MAYR 0.889 8.000 4 COUN 0.556 5.000 5 INDU 0.556 5.000 6 WELF 0.556 5.000 7 EDUC 0.444 4.000 8 UWAY 0.222 2.000 9 WEST 0.222 2.000 10 WRO 0.111 1.000 Out-degree centrality
For any node, e.g. an individual or a resource, the out-links are the connections that the node of interest sends to other nodes. For example, imagine an agent by knowledge matrix then the number of out-links an agent would have is the number of pieces of knowledge it is connected to. The scientific name of this measure is out-degree and it is calculated on the agent by agent matrices. Individuals or organizations who are high in most knowledge have more expertise or are associated with more types of knowledge than are others. If no sub-network connecting agents to knowledge exists, then this measure will not be calculated. The scientific name of this measure is out degree centrality and it is calculated on agent by knowledge matrices. Individuals or organizations who are high in "most resources" have more resources or are associated with more types of resources than are others. If no sub-network connecting agents to resources exists, then this measure will not be calculated. The scientific name of this measure is out degree centrality and it is calculated on agent by resource matrices.
Input network(s): KNOKI
Rank Organization Value Unscaled 1 MAYR 0.889 8.000 2 COMM 0.778 7.000 3 EDUC 0.667 6.000 4 UWAY 0.667 6.000 5 WEST 0.556 5.000 6 COUN 0.444 4.000 7 INDU 0.444 4.000 8 WRO 0.333 3.000 9 NEWS 0.333 3.000 10 WELF 0.333 3.000 Eigenvector centrality
Calculates the principal eigenvector of the network. A node is central to the extent that its neighbors are central. Leaders of strong cliques are individuals who or organizations who are collected to others that are themselves highly connected to each other. In other words, if you have a clique then the individual most connected to others in the clique and other cliques, is the leader of the clique. Individuals or organizations who are connected to many otherwise isolated individuals or organizations will have a much lower score in this measure then those that are connected to groups that have many connections themselves. The scientific name of this measure is eigenvector centrality and it is calculated on agent by agent matrices.
Input network: KNOKI (size: 10, density: 0.544444)
Rank Organization Value Unscaled Context* 1 NEWS 0.561 0.397 -0.517 2 COMM 0.535 0.379 -0.634 3 MAYR 0.535 0.379 -0.634 4 COUN 0.485 0.343 -0.861 5 UWAY 0.437 0.309 -1.077 6 INDU 0.435 0.308 -1.087 7 WELF 0.407 0.288 -1.214 8 EDUC 0.390 0.276 -1.292 9 WEST 0.371 0.262 -1.379 10 WRO 0.201 0.142 -2.147 * Number of standard deviations from the mean of a random network of the same size and density
Mean: 0.436 Mean in random network: 0.676 Std.dev: 0.100 Std.dev in random network: 0.221 Eigenvector centrality per component
Calculates the principal eigenvector of the network. A node is central to the extent that its neighbors are central. Each component is extracted as a separate network, Eigenvector Centrality is computed on it and scaled according to the component size. The scores are then combined into a single result vector.
Input network(s): KNOKI
Rank Organization Value 1 NEWS 0.397 2 COMM 0.379 3 MAYR 0.379 4 COUN 0.343 5 UWAY 0.309 6 INDU 0.308 7 WELF 0.288 8 EDUC 0.276 9 WEST 0.262 10 WRO 0.142 Closeness centrality
The average closeness of a node to the other nodes in a network (also called out-closeness). Loosely, Closeness is the inverse of the average distance in the network from the node to all other nodes.
Input network: KNOKI (size: 10, density: 0.544444)
Rank Organization Value Unscaled Context* 1 MAYR 0.900 0.100 2.704 2 COMM 0.818 0.091 1.679 3 EDUC 0.750 0.083 0.825 4 UWAY 0.692 0.077 0.103 5 WEST 0.692 0.077 0.103 6 COUN 0.600 0.067 -1.053 7 INDU 0.600 0.067 -1.053 8 NEWS 0.563 0.063 -1.523 9 WELF 0.563 0.063 -1.523 10 WRO 0.529 0.059 -1.937 * Number of standard deviations from the mean of a random network of the same size and density
Mean: 0.671 Mean in random network: 0.684 Std.dev: 0.116 Std.dev in random network: 0.080 In-Closeness centrality
The average closeness of a node from the other nodes in a network. Loosely, Closeness is the inverse of the average distance in the network to the node and from all other nodes.
Input network(s): KNOKI
Rank Organization Value Unscaled 1 NEWS 1.000 0.111 2 COMM 0.900 0.100 3 MAYR 0.900 0.100 4 INDU 0.692 0.077 5 WELF 0.692 0.077 6 COUN 0.643 0.071 7 EDUC 0.643 0.071 8 WEST 0.563 0.063 9 UWAY 0.529 0.059 10 WRO 0.409 0.045 Betweenness centrality
The Betweenness Centrality of node v in a network is defined as: across all node pairs that have a shortest path containing v, the percentage that pass through v. Individuals or organizations that are potentially influential are positioned to broker connections between groups and to bring to bear the influence of one group on another or serve as a gatekeeper between groups. This agent occurs on many of the shortest paths between other agents. The scientific name of this measure is betweenness centrality and it is calculated on agent by agent matrices.
Input network: KNOKI (size: 10, density: 0.544444)
Rank Organization Value Unscaled Context* 1 MAYR 0.248 17.833 2.912 2 COMM 0.171 12.333 1.748 3 EDUC 0.162 11.694 1.612 4 NEWS 0.038 2.750 -0.282 5 WELF 0.017 1.222 -0.605 6 INDU 0.011 0.806 -0.693 7 COUN 0.009 0.667 -0.723 8 WEST 0.005 0.361 -0.787 9 WRO 0.005 0.333 -0.793 * Number of standard deviations from the mean of a random network of the same size and density
Mean: 0.067 Mean in random network: 0.057 Std.dev: 0.086 Std.dev in random network: 0.066 Hub centrality
A node is hub-central to the extent that its out-links are to nodes that have many in-links. Individuals or organizations that act as hubs are sending information to a wide range of others each of whom has many others reporting to them. Technically, an agent is hub-central if its out-links are to agents that have many other agents sending links to them. The scientific name of this measure is hub centrality and it is calculated on agent by agent matrices.
Input network(s): KNOKI
Rank Organization Value 1 MAYR 0.581 2 UWAY 0.565 3 COMM 0.548 4 WEST 0.475 5 EDUC 0.460 6 INDU 0.418 7 COUN 0.411 8 WELF 0.339 9 NEWS 0.290 10 WRO 0.253 Authority centrality
A node is authority-central to the extent that its in-links are from nodes that have many out-links. Individuals or organizations that act as authorities are receiving information from a wide range of others each of whom sends information to a large number of others. Technically, an agent is authority-central if its in-links are from agents that have are sending links to many others. The scientific name of this measure is authority centrality and it is calculated on agent by agent matrices.
Input network(s): KNOKI
Rank Organization Value 1 NEWS 0.708 2 COMM 0.619 3 MAYR 0.613 4 COUN 0.452 5 INDU 0.427 6 WELF 0.412 7 EDUC 0.325 8 UWAY 0.197 9 WEST 0.182 10 WRO 0.080 Information centrality
Calculate the Stephenson and Zelen information centrality measure for each node.
Input network(s): KNOKI
Rank Organization Value Unscaled 1 MAYR 0.125 3.407 2 COMM 0.119 3.247 3 UWAY 0.111 3.028 4 EDUC 0.111 3.006 5 WEST 0.102 2.768 6 COUN 0.095 2.577 7 INDU 0.093 2.526 8 NEWS 0.086 2.333 9 WELF 0.082 2.225 10 WRO 0.076 2.063 Clique membership count
The number of distinct cliques to which each node belongs. Individuals or organizations who are high in number of cliques are those that belong to a large number of distinct cliques. A clique is defined as a group of three or more actors that have many connections to each other and relatively fewer connections to those in other groups. The scientific name of this measure is clique count and it is calculated on the agent by agent matrices.
Input network(s): KNOKI
Rank Organization Value 1 NEWS 7.000 2 COMM 5.000 3 MAYR 5.000 4 COUN 3.000 5 EDUC 3.000 6 INDU 2.000 7 WRO 2.000 8 UWAY 2.000 9 WELF 2.000 10 WEST 2.000 Simmelian ties
The normalized number of Simmelian ties of each node.
Input network(s): KNOKI
Rank Organization Value Unscaled 1 MAYR 0.889 8.000 2 COMM 0.778 7.000 3 EDUC 0.333 3.000 4 INDU 0.333 3.000 5 NEWS 0.333 3.000 6 COUN 0.222 2.000 7 UWAY 0.222 2.000 8 WELF 0.222 2.000 9 WEST 0.222 2.000 Clustering coefficient
Measures the degree of clustering in a network by averaging the clustering coefficient of each node, which is defined as the density of the node's ego network.
Input network(s): KNOKI
Rank Organization Value 1 UWAY 0.800 2 WEST 0.800 3 INDU 0.733 4 COUN 0.667 5 WELF 0.600 6 EDUC 0.567 7 COMM 0.536 8 MAYR 0.518 9 NEWS 0.514 10 WRO 0.333
Key Nodes Table
This shows the top scoring nodes side-by-side for selected measures.
Rank Betweenness centrality Closeness centrality Eigenvector centrality Eigenvector centrality per component In-degree centrality In-Closeness centrality Out-degree centrality Total degree centrality 1 MAYR MAYR NEWS NEWS NEWS NEWS MAYR MAYR 2 COMM COMM COMM COMM COMM COMM COMM COMM 3 EDUC EDUC MAYR MAYR MAYR MAYR EDUC NEWS 4 NEWS UWAY COUN COUN COUN INDU UWAY EDUC 5 WELF WEST UWAY UWAY INDU WELF WEST COUN 6 INDU COUN INDU INDU WELF COUN COUN INDU 7 COUN INDU WELF WELF EDUC EDUC INDU UWAY 8 WEST NEWS EDUC EDUC UWAY WEST WRO WELF 9 WRO WELF WEST WEST WEST UWAY NEWS WEST 10 UWAY WRO WRO WRO WRO WRO WELF WRO