Calculates common social network measures on each selected input network.
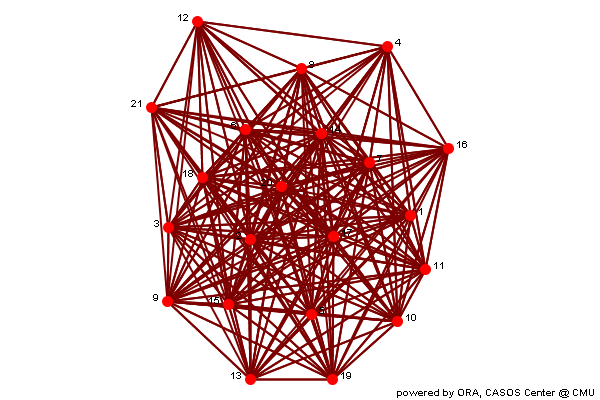
Analysis for the Meta-Network
Individual entity classes have been combined into a single class, and all networks are combined to create a single network. If two networks connect the same entities, e.g. two agent x agent, then the links are combined. Link weights are made binary.
Row count 21 Column count 21 Link count 373 Density 0.8881 Isolate count 0 Component count 1 Reciprocity 0.8557 Characteristic path length 1.112 Clustering coefficient 0.8978 Network levels (diameter) 2 Network fragmentation 0 Krackhardt connectedness 1 Krackhardt efficiency 0.04737 Krackhardt hierarchy 0 Krackhardt upperboundedness 1 Degree centralization 0.1237 Betweenness centralization 0.005737 Closeness centralization 0.1884
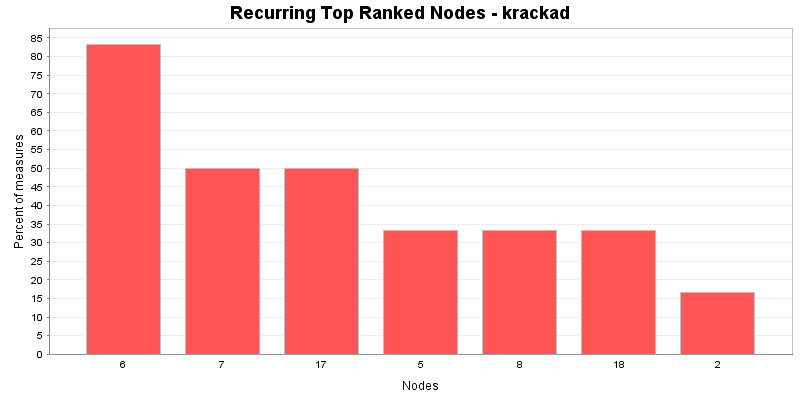
Min Max Average Stddev Total degree centrality 0.65 1 0.8881 0.09469 Total degree centrality (unscaled) 26 40 35.52 3.787 Eigenvector centrality 0.7687 1 0.9629 0.05802 Hub centrality 0.5623 1 0.8918 0.134 Authority centrality 0.7166 1 0.9057 0.08202 Betweenness centrality 0.0004472 0.01135 0.00589 0.003859 Betweenness centrality (unscaled) 0.1699 4.314 2.238 1.466 Information centrality 0.03715 0.05079 0.04762 0.004295 Information centrality (unscaled) 7.445 10.18 9.544 0.8608 Clique membership count 2 6 4.667 1.643 Simmelian ties 0.55 1 0.819 0.141 Simmelian ties (unscaled) 11 20 16.38 2.82 Clustering coefficient 0.8763 0.9379 0.8978 0.02119 Key nodes
This chart shows the Nodes that repeatedly rank in the top three in the measures. The value shown is the percentage of measures for which the Nodes was ranked in the top three.
In-degree centrality
The In Degree Centrality of a node is its normalized in-degree.
Input network(s): meta-network
Rank Value Unscaled Nodes 1 1 20 2 2 1 20 6 3 1 20 8 4 1 20 17 5 1 20 18 6 0.95 19 1 7 0.95 19 7 8 0.95 19 14 9 0.95 19 21 10 0.9 18 3 Out-degree centrality
The Out Degree Centrality of a node is its normalized out-degree.
Input network(s): meta-network
Rank Value Unscaled Nodes 1 1 20 5 2 1 20 6 3 1 20 7 4 1 20 14 5 1 20 15 6 1 20 17 7 1 20 18 8 1 20 20 9 0.95 19 2 10 0.95 19 3 Total degree centrality
The Total Degree Centrality of a node is the normalized sum of its row and column degrees.
Input network(s): meta-network
Input network size: 21
Input network density: 0.888095
Expected value from a random network of the same size and density: 0.888095
Rank Value Unscaled Nodes Context* 1 1 40 6 1.62669 2 1 40 17 1.62669 3 1 40 18 1.62669 4 0.975 39 2 1.26328 5 0.975 39 7 1.26328 6 0.975 39 14 1.26328 7 0.95 38 20 0.899869 8 0.925 37 1 0.536461 9 0.925 37 3 0.536461 10 0.925 37 11 0.536461 * Number of standard deviations from the mean if links were distributed randomly Mean: 0.888095 Std.dev: 0.068793 Eigenvector centrality
Calculates the principal eigenvector of the network. A node is central to the extent that its neighbors are central.
Input network(s): meta-network
Input network size: 21
Input network density: 0.888095
Expected value from a random network of the same size and density: 0.906038
Rank Value Nodes Context* 1 1 8 0.395596 2 1 7 0.395596 3 1 17 0.395596 4 1 1 0.395596 5 1 6 0.395596 6 1 2 0.395596 7 1 3 0.395596 8 1 15 0.395596 9 1 18 0.395595 10 1 20 0.395595 * Number of standard deviations from the mean if links were distributed randomly Mean: 0.906038 Std.dev: 0.237521 Betweenness centrality
The Betweenness Centrality of node v in a network is defined as: across all node pairs that have a shortest path containing v, the percentage that pass through v.
Input network(s): meta-network
Input network size: 21
Input network density: 0.888095
Expected value from a random network of the same size and density: -0.00778867
Rank Value Unscaled Nodes Context* 1 0.0113534 4.3143 6 0.918542 2 0.0113534 4.3143 17 0.918542 3 0.0113534 4.3143 18 0.918542 4 0.0110524 4.19992 2 0.904099 5 0.01085 4.123 20 0.894385 6 0.00956672 3.63535 7 0.832807 7 0.00952818 3.62071 14 0.830957 8 0.00714423 2.71481 1 0.716563 9 0.00633535 2.40743 3 0.677748 10 0.00585954 2.22662 8 0.654916 * Number of standard deviations from the mean if links were distributed randomly Mean: -0.00778867 Std.dev: 0.0208396 Closeness centrality
The average closeness of a node to the other nodes in a network. Loosely, Closeness is the inverse of the average distance in the network between the node and all other nodes.
Input network(s): meta-network
Input network size: 21
Input network density: 0.888095
Expected value from a random network of the same size and density: 0.818861
Rank Value Unscaled Nodes Context* 1 1 0.05 5 5.48474 2 1 0.05 6 5.48474 3 1 0.05 7 5.48474 4 1 0.05 14 5.48474 5 1 0.05 15 5.48474 6 1 0.05 17 5.48474 7 1 0.05 18 5.48474 8 1 0.05 20 5.48474 9 0.952381 0.047619 2 4.04288 10 0.952381 0.047619 3 4.04288 * Number of standard deviations from the mean if links were distributed randomly Mean: 0.818861 Std.dev: 0.033026