Calculates common social network measures on each selected input network.
Network test
Network Level Measures
Measure Value Row count 34.000 Column count 34.000 Link count 80.000 Density 0.071 Components of 1 node (isolates) 0 Components of 2 nodes (dyadic isolates) 0 Components of 3 or more nodes 1 Reciprocity 0.013 Characteristic path length 2.044 Clustering coefficient 0.065 Network levels (diameter) 5.000 Network fragmentation 0.000 Krackhardt connectedness 1.000 Krackhardt efficiency 0.913 Krackhardt hierarchy 0.995 Krackhardt upperboundedness 0.551 Degree centralization 0.117 Betweenness centralization 0.034 Closeness centralization 0.032 Eigenvector centralization 0.365 Reciprocal (symmetric)? No (1% of the links are reciprocal)
Node Level Measures
Measure Min Max Avg Stddev Total degree centrality 0.015 0.182 0.071 0.045 Total degree centrality [Unscaled] 1.000 12.000 4.706 2.976 In-degree centrality 0.000 0.242 0.071 0.079 In-degree centrality [Unscaled] 0.000 8.000 2.353 2.600 Out-degree centrality 0.000 0.303 0.071 0.083 Out-degree centrality [Unscaled] 0.000 10.000 2.353 2.732 Eigenvector centrality 0.003 0.535 0.192 0.149 Eigenvector centrality [Unscaled] 0.002 0.378 0.135 0.105 Eigenvector centrality per component 0.002 0.378 0.135 0.105 Closeness centrality 0.029 0.052 0.037 0.007 Closeness centrality [Unscaled] 0.001 0.002 0.001 0.000 In-Closeness centrality 0.029 0.070 0.039 0.014 In-Closeness centrality [Unscaled] 0.001 0.002 0.001 0.000 Betweenness centrality 0.000 0.039 0.006 0.012 Betweenness centrality [Unscaled] 0.000 41.500 6.294 12.347 Hub centrality 0.000 0.718 0.143 0.196 Authority centrality 0.000 0.590 0.148 0.192 Information centrality 0.000 0.073 0.029 0.025 Information centrality [Unscaled] 0.000 2.742 1.100 0.941 Clique membership count 0.000 13.000 2.059 3.067 Simmelian ties 0.000 0.000 0.000 0.000 Simmelian ties [Unscaled] 0.000 0.000 0.000 0.000 Clustering coefficient 0.000 0.500 0.065 0.104
Key Nodes
This chart shows the Agent that is repeatedly top-ranked in the measures listed below. The value shown is the percentage of measures for which the Agent was ranked in the top three.

Total degree centrality
The Total Degree Centrality of a node is the normalized sum of its row and column degrees. Individuals or organizations who are "in the know" are those who are linked to many others and so, by virtue of their position have access to the ideas, thoughts, beliefs of many others. Individuals who are "in the know" are identified by degree centrality in the relevant social network. Those who are ranked high on this metrics have more connections to others in the same network. The scientific name of this measure is total degree centrality and it is calculated on the agent by agent matrices.
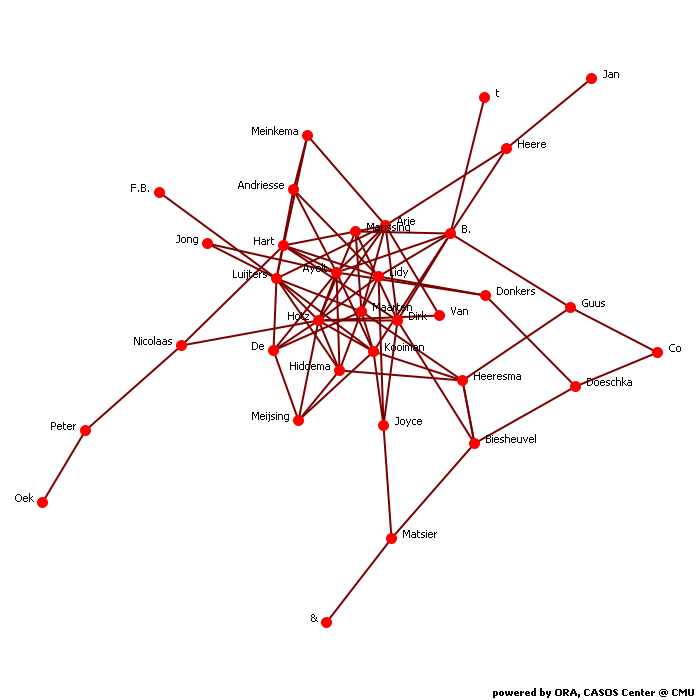
Input network: test (size: 34, density: 0.0713012)
Rank Agent Value Unscaled Context* 1 Hotz 0.182 12.000 2.504 2 Ayelt 0.152 10.000 1.818 3 Luijters 0.152 10.000 1.818 4 Arie 0.136 9.000 1.474 5 Maarten 0.121 8.000 1.131 6 B. 0.121 8.000 1.131 7 Kooiman 0.121 8.000 1.131 8 Hart 0.106 7.000 0.788 9 Dirk 0.106 7.000 0.788 10 Lidy 0.106 7.000 0.788 * Number of standard deviations from the mean of a random network of the same size and density
Mean: 0.071 Mean in random network: 0.071 Std.dev: 0.045 Std.dev in random network: 0.044 In-degree centrality
The In Degree Centrality of a node is its normalized in-degree. For any node, e.g. an individual or a resource, the in-links are the connections that the node of interest receives from other nodes. For example, imagine an agent by knowledge matrix then the number of in-links a piece of knowledge has is the number of agents that are connected to. The scientific name of this measure is in-degree and it is calculated on the agent by agent matrices.
Input network(s): test
Rank Agent Value Unscaled 1 Arie 0.242 8.000 2 Hotz 0.242 8.000 3 Hart 0.212 7.000 4 B. 0.212 7.000 5 Hiddema 0.182 6.000 6 Kooiman 0.182 6.000 7 De 0.152 5.000 8 Andriesse 0.121 4.000 9 Biesheuvel 0.121 4.000 10 Maarten 0.121 4.000 Out-degree centrality
For any node, e.g. an individual or a resource, the out-links are the connections that the node of interest sends to other nodes. For example, imagine an agent by knowledge matrix then the number of out-links an agent would have is the number of pieces of knowledge it is connected to. The scientific name of this measure is out-degree and it is calculated on the agent by agent matrices. Individuals or organizations who are high in most knowledge have more expertise or are associated with more types of knowledge than are others. If no sub-network connecting agents to knowledge exists, then this measure will not be calculated. The scientific name of this measure is out degree centrality and it is calculated on agent by knowledge matrices. Individuals or organizations who are high in "most resources" have more resources or are associated with more types of resources than are others. If no sub-network connecting agents to resources exists, then this measure will not be calculated. The scientific name of this measure is out degree centrality and it is calculated on agent by resource matrices.
Input network(s): test
Rank Agent Value Unscaled 1 Ayelt 0.303 10.000 2 Luijters 0.303 10.000 3 Dirk 0.212 7.000 4 Lidy 0.212 7.000 5 Marissing 0.152 5.000 6 Maarten 0.121 4.000 7 Hotz 0.121 4.000 8 Meijsing 0.121 4.000 9 Heeresma 0.091 3.000 10 Heere 0.091 3.000 Eigenvector centrality
Calculates the principal eigenvector of the network. A node is central to the extent that its neighbors are central. Leaders of strong cliques are individuals who or organizations who are collected to others that are themselves highly connected to each other. In other words, if you have a clique then the individual most connected to others in the clique and other cliques, is the leader of the clique. Individuals or organizations who are connected to many otherwise isolated individuals or organizations will have a much lower score in this measure then those that are connected to groups that have many connections themselves. The scientific name of this measure is eigenvector centrality and it is calculated on agent by agent matrices.
Input network: test (size: 34, density: 0.0713012)
Rank Agent Value Unscaled Context* 1 Hotz 0.535 0.378 0.657 2 Luijters 0.437 0.309 0.314 3 Ayelt 0.429 0.303 0.285 4 Arie 0.406 0.287 0.204 5 Maarten 0.384 0.271 0.125 6 Kooiman 0.383 0.270 0.121 7 Marissing 0.322 0.228 -0.091 8 Hiddema 0.320 0.226 -0.099 9 Dirk 0.302 0.214 -0.162 10 Hart 0.296 0.210 -0.182 * Number of standard deviations from the mean of a random network of the same size and density
Mean: 0.192 Mean in random network: 0.348 Std.dev: 0.149 Std.dev in random network: 0.284 Eigenvector centrality per component
Calculates the principal eigenvector of the network. A node is central to the extent that its neighbors are central. Each component is extracted as a separate network, Eigenvector Centrality is computed on it and scaled according to the component size. The scores are then combined into a single result vector.
Input network(s): test
Rank Agent Value 1 Hotz 0.378 2 Luijters 0.309 3 Ayelt 0.303 4 Arie 0.287 5 Maarten 0.271 6 Kooiman 0.270 7 Marissing 0.228 8 Hiddema 0.226 9 Dirk 0.214 10 Hart 0.210 Closeness centrality
The average closeness of a node to the other nodes in a network (also called out-closeness). Loosely, Closeness is the inverse of the average distance in the network from the node to all other nodes.
Input network: test (size: 34, density: 0.0713012)
Rank Agent Value Unscaled Context* 1 Luijters 0.052 0.002 -4.219 2 Ayelt 0.052 0.002 -4.221 3 Lidy 0.049 0.001 -4.283 4 Nicolaas 0.048 0.001 -4.305 5 Dirk 0.047 0.001 -4.335 6 Marissing 0.045 0.001 -4.390 7 Meinkema 0.044 0.001 -4.409 8 Meijsing 0.043 0.001 -4.443 9 Heere 0.043 0.001 -4.446 10 Van 0.043 0.001 -4.446 * Number of standard deviations from the mean of a random network of the same size and density
Mean: 0.037 Mean in random network: 0.229 Std.dev: 0.007 Std.dev in random network: 0.042 In-Closeness centrality
The average closeness of a node from the other nodes in a network. Loosely, Closeness is the inverse of the average distance in the network to the node and from all other nodes.
Input network(s): test
Rank Agent Value Unscaled 1 t 0.070 0.002 2 B. 0.068 0.002 3 Joyce 0.067 0.002 4 Hiddema 0.064 0.002 5 Kooiman 0.064 0.002 6 Heeresma 0.060 0.002 7 Biesheuvel 0.059 0.002 8 De 0.047 0.001 9 Maarten 0.045 0.001 10 Arie 0.043 0.001 Betweenness centrality
The Betweenness Centrality of node v in a network is defined as: across all node pairs that have a shortest path containing v, the percentage that pass through v. Individuals or organizations that are potentially influential are positioned to broker connections between groups and to bring to bear the influence of one group on another or serve as a gatekeeper between groups. This agent occurs on many of the shortest paths between other agents. The scientific name of this measure is betweenness centrality and it is calculated on agent by agent matrices.
Input network: test (size: 34, density: 0.0713012)
Rank Agent Value Unscaled Context* 1 Maarten 0.039 41.500 -0.140 2 Kooiman 0.036 38.000 -0.158 3 Heeresma 0.030 32.000 -0.189 4 Arie 0.030 31.500 -0.192 5 Hotz 0.026 27.500 -0.212 6 B. 0.019 20.000 -0.251 7 Biesheuvel 0.009 10.000 -0.302 8 Guus 0.009 9.000 -0.307 9 Co 0.003 3.000 -0.338 10 Peter 0.001 1.000 -0.349 * Number of standard deviations from the mean of a random network of the same size and density
Mean: 0.006 Mean in random network: 0.065 Std.dev: 0.012 Std.dev in random network: 0.184 Hub centrality
A node is hub-central to the extent that its out-links are to nodes that have many in-links. Individuals or organizations that act as hubs are sending information to a wide range of others each of whom has many others reporting to them. Technically, an agent is hub-central if its out-links are to agents that have many other agents sending links to them. The scientific name of this measure is hub centrality and it is calculated on agent by agent matrices.
Input network(s): test
Rank Agent Value 1 Ayelt 0.718 2 Luijters 0.678 3 Lidy 0.447 4 Dirk 0.429 5 Marissing 0.411 6 Meijsing 0.315 7 Hotz 0.308 8 Meinkema 0.253 9 Maarten 0.222 10 Nicolaas 0.203 Authority centrality
A node is authority-central to the extent that its in-links are from nodes that have many out-links. Individuals or organizations that act as authorities are receiving information from a wide range of others each of whom sends information to a large number of others. Technically, an agent is authority-central if its in-links are from agents that have are sending links to many others. The scientific name of this measure is authority centrality and it is calculated on agent by agent matrices.
Input network(s): test
Rank Agent Value 1 Hotz 0.590 2 Arie 0.550 3 Hart 0.545 4 Hiddema 0.418 5 Kooiman 0.418 6 B. 0.410 7 De 0.389 8 Andriesse 0.364 9 Maarten 0.275 10 Jong 0.242 Information centrality
Calculate the Stephenson and Zelen information centrality measure for each node.
Input network(s): test
Rank Agent Value Unscaled 1 Ayelt 0.073 2.742 2 Luijters 0.073 2.742 3 Dirk 0.066 2.477 4 Lidy 0.066 2.458 5 Marissing 0.058 2.184 6 Maarten 0.056 2.083 7 Hotz 0.054 2.026 8 Meijsing 0.052 1.959 9 Doeschka 0.046 1.735 10 Heere 0.046 1.708 Clique membership count
The number of distinct cliques to which each node belongs. Individuals or organizations who are high in number of cliques are those that belong to a large number of distinct cliques. A clique is defined as a group of three or more actors that have many connections to each other and relatively fewer connections to those in other groups. The scientific name of this measure is clique count and it is calculated on the agent by agent matrices.
Input network(s): test
Rank Agent Value 1 Hotz 13.000 2 Luijters 8.000 3 Maarten 7.000 4 Arie 6.000 5 Kooiman 6.000 6 Hiddema 5.000 7 Ayelt 5.000 8 De 4.000 9 Marissing 4.000 10 Dirk 3.000 Simmelian ties
The normalized number of Simmelian ties of each node.
Input network(s): test
Rank Agent Value Unscaled 1 All nodes have this value 0.000 Clustering coefficient
Measures the degree of clustering in a network by averaging the clustering coefficient of each node, which is defined as the density of the node's ego network.
Input network(s): test
Rank Agent Value 1 Van 0.500 2 Meijsing 0.250 3 De 0.200 4 Marissing 0.200 5 Hiddema 0.167 6 Maarten 0.125 7 Dirk 0.119 8 Hotz 0.114 9 Arie 0.111 10 Kooiman 0.107
Key Nodes Table
This shows the top scoring nodes side-by-side for selected measures.
Rank Betweenness centrality Closeness centrality Eigenvector centrality Eigenvector centrality per component In-degree centrality In-Closeness centrality Out-degree centrality Total degree centrality 1 Maarten Luijters Hotz Hotz Arie t Ayelt Hotz 2 Kooiman Ayelt Luijters Luijters Hotz B. Luijters Ayelt 3 Heeresma Lidy Ayelt Ayelt Hart Joyce Dirk Luijters 4 Arie Nicolaas Arie Arie B. Hiddema Lidy Arie 5 Hotz Dirk Maarten Maarten Hiddema Kooiman Marissing Maarten 6 B. Marissing Kooiman Kooiman Kooiman Heeresma Maarten B. 7 Biesheuvel Meinkema Marissing Marissing De Biesheuvel Hotz Kooiman 8 Guus Meijsing Hiddema Hiddema Andriesse De Meijsing Hart 9 Co Heere Dirk Dirk Biesheuvel Maarten Heeresma Dirk 10 Peter Van Hart Hart Maarten Arie Heere Lidy