Calculates common social network measures on each selected input network.
Network test
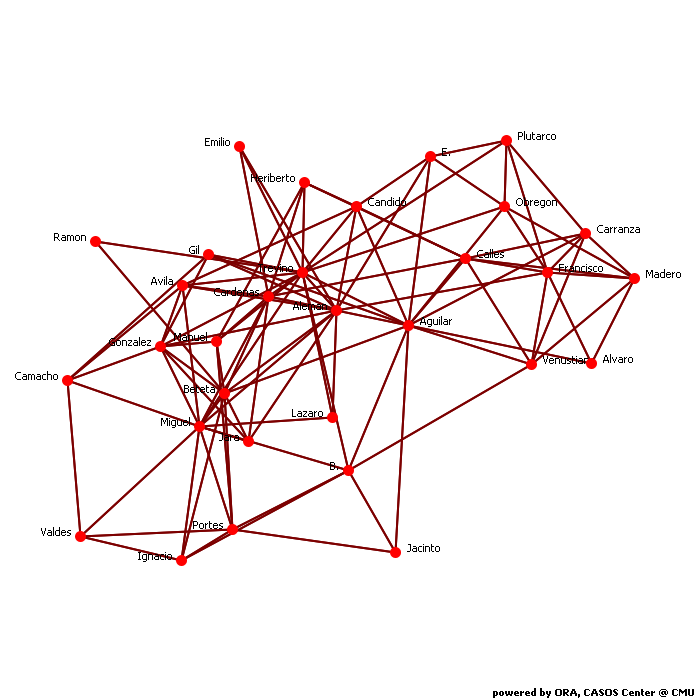
Network Level Measures
Measure Value Row count 31.000 Column count 31.000 Link count 107.000 Density 0.216 Components of 1 node (isolates) 0 Components of 2 nodes (dyadic isolates) 0 Components of 3 or more nodes 1 Reciprocity 1.000 Characteristic path length 2.004 Clustering coefficient 0.389 Network levels (diameter) 4.000 Network fragmentation 0.000 Krackhardt connectedness 1.000 Krackhardt efficiency 0.823 Krackhardt hierarchy 0.000 Krackhardt upperboundedness 1.000 Degree centralization 0.316 Betweenness centralization 0.177 Closeness centralization 0.368 Eigenvector centralization 0.316 Reciprocal (symmetric)? Yes
Node Level Measures
Measure Min Max Avg Stddev Total degree centrality 0.065 0.516 0.221 0.110 Total degree centrality [Unscaled] 2.000 16.000 6.839 3.399 In-degree centrality 0.065 0.516 0.221 0.110 In-degree centrality [Unscaled] 2.000 16.000 6.839 3.399 Out-degree centrality 0.065 0.516 0.221 0.110 Out-degree centrality [Unscaled] 2.000 16.000 6.839 3.399 Eigenvector centrality 0.083 0.521 0.225 0.117 Eigenvector centrality [Unscaled] 0.058 0.368 0.159 0.083 Eigenvector centrality per component 0.058 0.368 0.159 0.083 Closeness centrality 0.417 0.682 0.507 0.065 Closeness centrality [Unscaled] 0.014 0.023 0.017 0.002 In-Closeness centrality 0.417 0.682 0.507 0.065 In-Closeness centrality [Unscaled] 0.014 0.023 0.017 0.002 Betweenness centrality 0.000 0.206 0.035 0.049 Betweenness centrality [Unscaled] 0.000 89.468 15.065 21.284 Hub centrality 0.083 0.521 0.225 0.117 Authority centrality 0.083 0.521 0.225 0.117 Information centrality 0.018 0.046 0.032 0.007 Information centrality [Unscaled] 1.397 3.673 2.551 0.549 Clique membership count 0.000 15.000 4.806 3.207 Simmelian ties 0.000 0.500 0.219 0.108 Simmelian ties [Unscaled] 0.000 15.000 6.581 3.231 Clustering coefficient 0.197 0.733 0.389 0.125
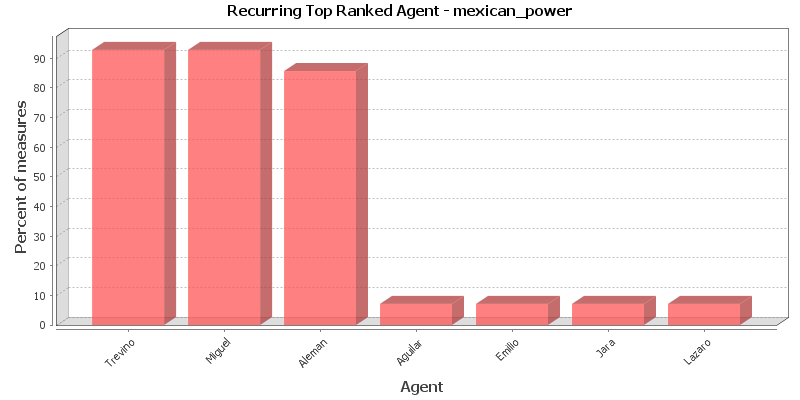
Key Nodes
This chart shows the Agent that is repeatedly top-ranked in the measures listed below. The value shown is the percentage of measures for which the Agent was ranked in the top three.
Total degree centrality
The Total Degree Centrality of a node is the normalized sum of its row and column degrees. Individuals or organizations who are "in the know" are those who are linked to many others and so, by virtue of their position have access to the ideas, thoughts, beliefs of many others. Individuals who are "in the know" are identified by degree centrality in the relevant social network. Those who are ranked high on this metrics have more connections to others in the same network. The scientific name of this measure is total degree centrality and it is calculated on the agent by agent matrices.
Input network: test (size: 31, density: 0.215726)
Rank Agent Value Unscaled Context* 1 Trevino 0.516 16.000 4.066 2 Aleman 0.484 15.000 3.630 3 Miguel 0.419 13.000 2.756 4 Aguilar 0.355 11.000 1.883 5 Beteta 0.355 11.000 1.883 6 Cardenas 0.323 10.000 1.446 7 Gonzalez 0.290 9.000 1.010 8 Francisco 0.258 8.000 0.573 9 Calles 0.258 8.000 0.573 10 Candido 0.226 7.000 0.136 * Number of standard deviations from the mean of a random network of the same size and density
Mean: 0.221 Mean in random network: 0.216 Std.dev: 0.110 Std.dev in random network: 0.074 In-degree centrality
The In Degree Centrality of a node is its normalized in-degree. For any node, e.g. an individual or a resource, the in-links are the connections that the node of interest receives from other nodes. For example, imagine an agent by knowledge matrix then the number of in-links a piece of knowledge has is the number of agents that are connected to. The scientific name of this measure is in-degree and it is calculated on the agent by agent matrices.
Input network(s): test
Rank Agent Value Unscaled 1 Trevino 0.516 16.000 2 Aleman 0.484 15.000 3 Miguel 0.419 13.000 4 Aguilar 0.355 11.000 5 Beteta 0.355 11.000 6 Cardenas 0.323 10.000 7 Gonzalez 0.290 9.000 8 Francisco 0.258 8.000 9 Calles 0.258 8.000 10 Candido 0.226 7.000 Out-degree centrality
For any node, e.g. an individual or a resource, the out-links are the connections that the node of interest sends to other nodes. For example, imagine an agent by knowledge matrix then the number of out-links an agent would have is the number of pieces of knowledge it is connected to. The scientific name of this measure is out-degree and it is calculated on the agent by agent matrices. Individuals or organizations who are high in most knowledge have more expertise or are associated with more types of knowledge than are others. If no sub-network connecting agents to knowledge exists, then this measure will not be calculated. The scientific name of this measure is out degree centrality and it is calculated on agent by knowledge matrices. Individuals or organizations who are high in "most resources" have more resources or are associated with more types of resources than are others. If no sub-network connecting agents to resources exists, then this measure will not be calculated. The scientific name of this measure is out degree centrality and it is calculated on agent by resource matrices.
Input network(s): test
Rank Agent Value Unscaled 1 Trevino 0.516 16.000 2 Aleman 0.484 15.000 3 Miguel 0.419 13.000 4 Aguilar 0.355 11.000 5 Beteta 0.355 11.000 6 Cardenas 0.323 10.000 7 Gonzalez 0.290 9.000 8 Francisco 0.258 8.000 9 Calles 0.258 8.000 10 Candido 0.226 7.000 Eigenvector centrality
Calculates the principal eigenvector of the network. A node is central to the extent that its neighbors are central. Leaders of strong cliques are individuals who or organizations who are collected to others that are themselves highly connected to each other. In other words, if you have a clique then the individual most connected to others in the clique and other cliques, is the leader of the clique. Individuals or organizations who are connected to many otherwise isolated individuals or organizations will have a much lower score in this measure then those that are connected to groups that have many connections themselves. The scientific name of this measure is eigenvector centrality and it is calculated on agent by agent matrices.
Input network: test (size: 31, density: 0.215726)
Rank Agent Value Unscaled Context* 1 Aleman 0.521 0.368 -0.050 2 Trevino 0.492 0.348 -0.152 3 Miguel 0.444 0.314 -0.321 4 Beteta 0.396 0.280 -0.489 5 Cardenas 0.379 0.268 -0.549 6 Gonzalez 0.361 0.255 -0.613 7 Avila 0.311 0.220 -0.787 8 Aguilar 0.287 0.203 -0.872 9 Candido 0.255 0.180 -0.985 10 Jara 0.249 0.176 -1.005 * Number of standard deviations from the mean of a random network of the same size and density
Mean: 0.225 Mean in random network: 0.535 Std.dev: 0.117 Std.dev in random network: 0.284 Eigenvector centrality per component
Calculates the principal eigenvector of the network. A node is central to the extent that its neighbors are central. Each component is extracted as a separate network, Eigenvector Centrality is computed on it and scaled according to the component size. The scores are then combined into a single result vector.
Input network(s): test
Rank Agent Value 1 Aleman 0.368 2 Trevino 0.348 3 Miguel 0.314 4 Beteta 0.280 5 Cardenas 0.268 6 Gonzalez 0.255 7 Avila 0.220 8 Aguilar 0.203 9 Candido 0.180 10 Jara 0.176 Closeness centrality
The average closeness of a node to the other nodes in a network (also called out-closeness). Loosely, Closeness is the inverse of the average distance in the network from the node to all other nodes.
Input network: test (size: 31, density: 0.215726)
Rank Agent Value Unscaled Context* 1 Trevino 0.682 0.023 3.967 2 Aleman 0.638 0.021 3.127 3 Miguel 0.612 0.020 2.624 4 Aguilar 0.588 0.020 2.161 5 Cardenas 0.588 0.020 2.161 6 Beteta 0.577 0.019 1.943 7 B. 0.556 0.019 1.530 8 Candido 0.536 0.018 1.148 9 Gonzalez 0.536 0.018 1.148 10 Avila 0.526 0.018 0.966 * Number of standard deviations from the mean of a random network of the same size and density
Mean: 0.507 Mean in random network: 0.476 Std.dev: 0.065 Std.dev in random network: 0.052 In-Closeness centrality
The average closeness of a node from the other nodes in a network. Loosely, Closeness is the inverse of the average distance in the network to the node and from all other nodes.
Input network(s): test
Rank Agent Value Unscaled 1 Trevino 0.682 0.023 2 Aleman 0.638 0.021 3 Miguel 0.612 0.020 4 Aguilar 0.588 0.020 5 Cardenas 0.588 0.020 6 Beteta 0.577 0.019 7 B. 0.556 0.019 8 Candido 0.536 0.018 9 Gonzalez 0.536 0.018 10 Avila 0.526 0.018 Betweenness centrality
The Betweenness Centrality of node v in a network is defined as: across all node pairs that have a shortest path containing v, the percentage that pass through v. Individuals or organizations that are potentially influential are positioned to broker connections between groups and to bring to bear the influence of one group on another or serve as a gatekeeper between groups. This agent occurs on many of the shortest paths between other agents. The scientific name of this measure is betweenness centrality and it is calculated on agent by agent matrices.
Input network: test (size: 31, density: 0.215726)
Rank Agent Value Unscaled Context* 1 Trevino 0.206 89.468 5.664 2 Aleman 0.157 68.403 3.961 3 Miguel 0.118 51.420 2.589 4 Aguilar 0.116 50.256 2.495 5 Beteta 0.066 28.635 0.747 6 B. 0.057 24.764 0.434 7 Cardenas 0.053 22.870 0.281 8 Calles 0.042 18.267 -0.091 9 Francisco 0.035 15.182 -0.340 10 Portes 0.027 11.587 -0.631 * Number of standard deviations from the mean of a random network of the same size and density
Mean: 0.035 Mean in random network: 0.045 Std.dev: 0.049 Std.dev in random network: 0.028 Hub centrality
A node is hub-central to the extent that its out-links are to nodes that have many in-links. Individuals or organizations that act as hubs are sending information to a wide range of others each of whom has many others reporting to them. Technically, an agent is hub-central if its out-links are to agents that have many other agents sending links to them. The scientific name of this measure is hub centrality and it is calculated on agent by agent matrices.
Input network(s): test
Rank Agent Value 1 Aleman 0.521 2 Trevino 0.492 3 Miguel 0.444 4 Beteta 0.396 5 Cardenas 0.379 6 Gonzalez 0.361 7 Avila 0.311 8 Aguilar 0.287 9 Candido 0.255 10 Jara 0.249 Authority centrality
A node is authority-central to the extent that its in-links are from nodes that have many out-links. Individuals or organizations that act as authorities are receiving information from a wide range of others each of whom sends information to a large number of others. Technically, an agent is authority-central if its in-links are from agents that have are sending links to many others. The scientific name of this measure is authority centrality and it is calculated on agent by agent matrices.
Input network(s): test
Rank Agent Value 1 Aleman 0.521 2 Trevino 0.492 3 Miguel 0.444 4 Beteta 0.396 5 Cardenas 0.379 6 Gonzalez 0.361 7 Avila 0.311 8 Aguilar 0.287 9 Candido 0.255 10 Jara 0.249 Information centrality
Calculate the Stephenson and Zelen information centrality measure for each node.
Input network(s): test
Rank Agent Value Unscaled 1 Trevino 0.046 3.673 2 Aleman 0.046 3.603 3 Miguel 0.043 3.380 4 Aguilar 0.041 3.279 5 Beteta 0.041 3.257 6 Cardenas 0.040 3.161 7 Gonzalez 0.038 3.012 8 Calles 0.036 2.844 9 Candido 0.035 2.786 10 Avila 0.035 2.775 Clique membership count
The number of distinct cliques to which each node belongs. Individuals or organizations who are high in number of cliques are those that belong to a large number of distinct cliques. A clique is defined as a group of three or more actors that have many connections to each other and relatively fewer connections to those in other groups. The scientific name of this measure is clique count and it is calculated on the agent by agent matrices.
Input network(s): test
Rank Agent Value 1 Trevino 15.000 2 Miguel 11.000 3 Aguilar 10.000 4 Aleman 10.000 5 Candido 7.000 6 Gonzalez 7.000 7 Francisco 6.000 8 Obregon 6.000 9 B. 6.000 10 Cardenas 6.000 Simmelian ties
The normalized number of Simmelian ties of each node.
Input network(s): test
Rank Agent Value Unscaled 1 Trevino 0.500 15.000 2 Aleman 0.467 14.000 3 Miguel 0.433 13.000 4 Aguilar 0.333 10.000 5 Cardenas 0.333 10.000 6 Gonzalez 0.300 9.000 7 Francisco 0.267 8.000 8 Calles 0.267 8.000 9 Beteta 0.267 8.000 10 Candido 0.233 7.000 Clustering coefficient
Measures the degree of clustering in a network by averaging the clustering coefficient of each node, which is defined as the density of the node's ego network.
Input network(s): test
Rank Agent Value 1 Jara 0.733 2 Emilio 0.667 3 Lazaro 0.667 4 Ignacio 0.533 5 Alvaro 0.500 6 Avila 0.500 7 Gonzalez 0.444 8 Carranza 0.429 9 Venustiano 0.429 10 Gil 0.400
Key Nodes Table
This shows the top scoring nodes side-by-side for selected measures.
Rank Betweenness centrality Closeness centrality Eigenvector centrality Eigenvector centrality per component In-degree centrality In-Closeness centrality Out-degree centrality Total degree centrality 1 Trevino Trevino Aleman Aleman Trevino Trevino Trevino Trevino 2 Aleman Aleman Trevino Trevino Aleman Aleman Aleman Aleman 3 Miguel Miguel Miguel Miguel Miguel Miguel Miguel Miguel 4 Aguilar Aguilar Beteta Beteta Aguilar Aguilar Aguilar Aguilar 5 Beteta Cardenas Cardenas Cardenas Beteta Cardenas Beteta Beteta 6 B. Beteta Gonzalez Gonzalez Cardenas Beteta Cardenas Cardenas 7 Cardenas B. Avila Avila Gonzalez B. Gonzalez Gonzalez 8 Calles Candido Aguilar Aguilar Francisco Candido Francisco Francisco 9 Francisco Gonzalez Candido Candido Calles Gonzalez Calles Calles 10 Portes Avila Jara Jara Candido Avila Candido Candido