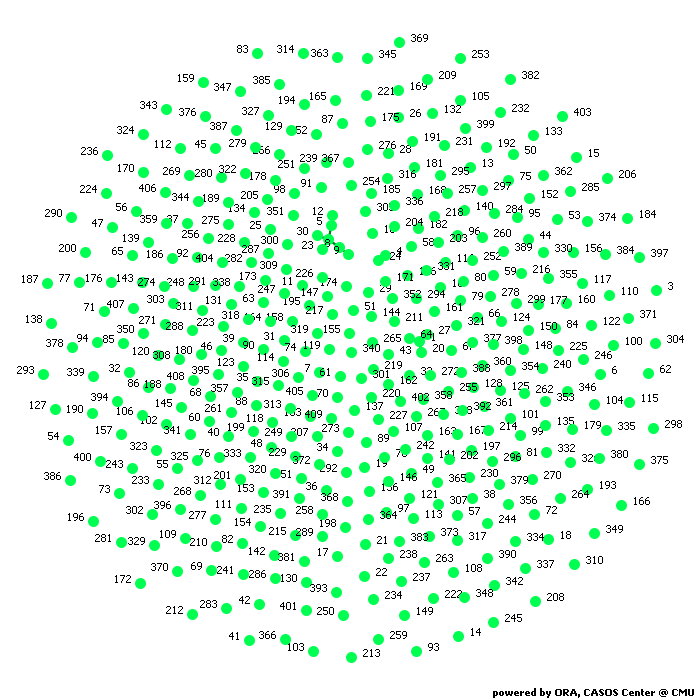
Calculates common social network measures on each selected input network.
Network agent x agent
Block Model - Newman's Clustering Algorithm
Network Level Measures
Measure Value Row count 1589.000 Column count 1589.000 Link count 2742.000 Density 0.002 Components of 1 node (isolates) 128 Components of 2 nodes (dyadic isolates) 102 Components of 3 or more nodes 166 Reciprocity 1.000 Characteristic path length 3.058 Clustering coefficient 0.638 Network levels (diameter) 9.333 Network fragmentation 0.940 Krackhardt connectedness 0.060 Krackhardt efficiency 0.979 Krackhardt hierarchy 0.000 Krackhardt upperboundedness 1.000 Degree centralization 0.004 Betweenness centralization 0.019 Closeness centralization 0.000 Eigenvector centralization 0.859 Reciprocal (symmetric)? Yes
Node Level Measures
Measure Min Max Avg Stddev Total degree centrality 0.000 0.004 0.000 0.000 Total degree centrality [Unscaled] 0.000 30.000 1.498 1.881 In-degree centrality 0.000 0.004 0.000 0.000 In-degree centrality [Unscaled] 0.000 30.000 1.498 1.881 Out-degree centrality 0.000 0.004 0.000 0.000 Out-degree centrality [Unscaled] 0.000 30.000 1.498 1.881 Eigenvector centrality 0.000 0.862 0.004 0.035 Eigenvector centrality [Unscaled] 0.000 0.610 0.003 0.025 Eigenvector centrality per component 0.000 0.145 0.002 0.006 Closeness centrality 0.000 0.000 0.000 0.000 Closeness centrality [Unscaled] 0.000 0.000 0.000 0.000 In-Closeness centrality 0.000 0.000 0.000 0.000 In-Closeness centrality [Unscaled] 0.000 0.000 0.000 0.000 Betweenness centrality 0.000 0.020 0.000 0.002 Betweenness centrality [Unscaled] 0.000 24786.043 324.041 1896.912 Hub centrality 0.000 0.862 0.004 0.035 Authority centrality 0.000 0.862 0.004 0.035 Information centrality -0.000 0.022 0.001 0.001 Information centrality [Unscaled] -0.000 0.000 0.000 0.000 Clique membership count 0.000 14.000 0.977 1.132 Simmelian ties 0.000 0.020 0.002 0.002 Simmelian ties [Unscaled] 0.000 32.000 3.173 3.566 Clustering coefficient 0.000 1.000 0.638 0.446
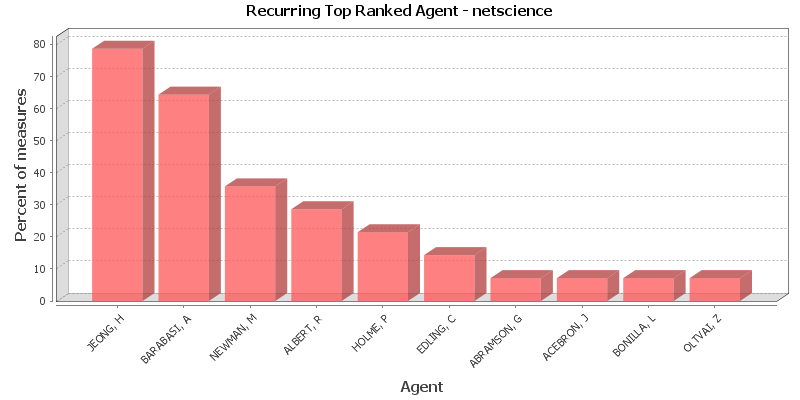
Key Nodes
This chart shows the Agent that is repeatedly top-ranked in the measures listed below. The value shown is the percentage of measures for which the Agent was ranked in the top three.
Total degree centrality
The Total Degree Centrality of a node is the normalized sum of its row and column degrees. Individuals or organizations who are "in the know" are those who are linked to many others and so, by virtue of their position have access to the ideas, thoughts, beliefs of many others. Individuals who are "in the know" are identified by degree centrality in the relevant social network. Those who are ranked high on this metrics have more connections to others in the same network. The scientific name of this measure is total degree centrality and it is calculated on the agent by agent matrices.
Input network: agent x agent (size: 1589, density: 0.00217332)
Rank Agent Value Unscaled Context* 1 BARABASI, A 0.004 30.000 1.544 2 NEWMAN, M 0.003 23.000 0.750 3 JEONG, H 0.002 18.000 0.182 4 PASTORSATORRAS, R 0.002 17.000 0.069 5 VESPIGNANI, A 0.002 15.000 -0.158 6 SOLE, R 0.002 15.000 -0.158 7 MORENO, Y 0.002 15.000 -0.158 8 YOUNG, M 0.002 13.000 -0.385 9 BOCCALETTI, S 0.002 12.000 -0.499 10 LATORA, V 0.001 11.000 -0.612 * Number of standard deviations from the mean of a random network of the same size and density
Mean: 0.000 Mean in random network: 0.002 Std.dev: 0.000 Std.dev in random network: 0.001 In-degree centrality
The In Degree Centrality of a node is its normalized in-degree. For any node, e.g. an individual or a resource, the in-links are the connections that the node of interest receives from other nodes. For example, imagine an agent by knowledge matrix then the number of in-links a piece of knowledge has is the number of agents that are connected to. The scientific name of this measure is in-degree and it is calculated on the agent by agent matrices.
Input network(s): agent x agent
Rank Agent Value Unscaled 1 BARABASI, A 0.004 30.000 2 NEWMAN, M 0.003 23.000 3 JEONG, H 0.002 18.000 4 PASTORSATORRAS, R 0.002 17.000 5 VESPIGNANI, A 0.002 15.000 6 SOLE, R 0.002 15.000 7 MORENO, Y 0.002 15.000 8 YOUNG, M 0.002 13.000 9 BOCCALETTI, S 0.002 12.000 10 LATORA, V 0.001 11.000 Out-degree centrality
For any node, e.g. an individual or a resource, the out-links are the connections that the node of interest sends to other nodes. For example, imagine an agent by knowledge matrix then the number of out-links an agent would have is the number of pieces of knowledge it is connected to. The scientific name of this measure is out-degree and it is calculated on the agent by agent matrices. Individuals or organizations who are high in most knowledge have more expertise or are associated with more types of knowledge than are others. If no sub-network connecting agents to knowledge exists, then this measure will not be calculated. The scientific name of this measure is out degree centrality and it is calculated on agent by knowledge matrices. Individuals or organizations who are high in "most resources" have more resources or are associated with more types of resources than are others. If no sub-network connecting agents to resources exists, then this measure will not be calculated. The scientific name of this measure is out degree centrality and it is calculated on agent by resource matrices.
Input network(s): agent x agent
Rank Agent Value Unscaled 1 BARABASI, A 0.004 30.000 2 NEWMAN, M 0.003 23.000 3 JEONG, H 0.002 18.000 4 PASTORSATORRAS, R 0.002 17.000 5 VESPIGNANI, A 0.002 15.000 6 SOLE, R 0.002 15.000 7 MORENO, Y 0.002 15.000 8 YOUNG, M 0.002 13.000 9 BOCCALETTI, S 0.002 12.000 10 LATORA, V 0.001 11.000 Eigenvector centrality
Calculates the principal eigenvector of the network. A node is central to the extent that its neighbors are central. Leaders of strong cliques are individuals who or organizations who are collected to others that are themselves highly connected to each other. In other words, if you have a clique then the individual most connected to others in the clique and other cliques, is the leader of the clique. Individuals or organizations who are connected to many otherwise isolated individuals or organizations will have a much lower score in this measure then those that are connected to groups that have many connections themselves. The scientific name of this measure is eigenvector centrality and it is calculated on agent by agent matrices.
Input network: agent x agent (size: 1589, density: 0.00217332)
Rank Agent Value Unscaled Context* 1 BARABASI, A 0.862 0.610 2.362 2 JEONG, H 0.640 0.452 0.565 3 ALBERT, R 0.445 0.315 -1.003 4 OLTVAI, Z 0.427 0.302 -1.154 5 VICSEK, T 0.314 0.222 -2.062 6 RAVASZ, E 0.309 0.219 -2.103 7 NEDA, Z 0.207 0.147 -2.924 8 YOOK, S 0.197 0.139 -3.010 9 BIANCONI, G 0.157 0.111 -3.332 10 FARKAS, I 0.139 0.098 -3.477 * Number of standard deviations from the mean of a random network of the same size and density
Mean: 0.004 Mean in random network: 0.570 Std.dev: 0.035 Std.dev in random network: 0.124 Eigenvector centrality per component
Calculates the principal eigenvector of the network. A node is central to the extent that its neighbors are central. Each component is extracted as a separate network, Eigenvector Centrality is computed on it and scaled according to the component size. The scores are then combined into a single result vector.
Input network(s): agent x agent
Rank Agent Value 1 BARABASI, A 0.145 2 JEONG, H 0.108 3 ALBERT, R 0.075 4 OLTVAI, Z 0.072 5 VICSEK, T 0.053 6 RAVASZ, E 0.052 7 NEDA, Z 0.035 8 YOOK, S 0.033 9 BIANCONI, G 0.026 10 FARKAS, I 0.023 Closeness centrality
The average closeness of a node to the other nodes in a network (also called out-closeness). Loosely, Closeness is the inverse of the average distance in the network from the node to all other nodes.
Input network: agent x agent (size: 1589, density: 0.00217332)
Rank Agent Value Unscaled Context* 1 HOLME, P 0.000 0.000 -4.283 2 JEONG, H 0.000 0.000 -4.283 3 EDLING, C 0.000 0.000 -4.283 4 LILJEROS, F 0.000 0.000 -4.283 5 NEWMAN, M 0.000 0.000 -4.283 6 YOON, C 0.000 0.000 -4.283 7 HAN, S 0.000 0.000 -4.283 8 STANLEY, H 0.000 0.000 -4.283 9 KIM, B 0.000 0.000 -4.283 10 CHUNG, J 0.000 0.000 -4.283 * Number of standard deviations from the mean of a random network of the same size and density
Mean: 0.000 Mean in random network: 0.307 Std.dev: 0.000 Std.dev in random network: 0.072 In-Closeness centrality
The average closeness of a node from the other nodes in a network. Loosely, Closeness is the inverse of the average distance in the network to the node and from all other nodes.
Input network(s): agent x agent
Rank Agent Value Unscaled 1 HOLME, P 0.000 0.000 2 EDLING, C 0.000 0.000 3 LILJEROS, F 0.000 0.000 4 JEONG, H 0.000 0.000 5 CHUNG, J 0.000 0.000 6 NEWMAN, M 0.000 0.000 7 STANLEY, H 0.000 0.000 8 MOSSA, S 0.000 0.000 9 CHOI, M 0.000 0.000 10 YOON, C 0.000 0.000 Betweenness centrality
The Betweenness Centrality of node v in a network is defined as: across all node pairs that have a shortest path containing v, the percentage that pass through v. Individuals or organizations that are potentially influential are positioned to broker connections between groups and to bring to bear the influence of one group on another or serve as a gatekeeper between groups. This agent occurs on many of the shortest paths between other agents. The scientific name of this measure is betweenness centrality and it is calculated on agent by agent matrices.
Input network: agent x agent (size: 1589, density: 0.00217332)
Rank Agent Value Unscaled Context* 1 HOLME, P 0.020 24786.043 0.027 2 JEONG, H 0.019 24462.338 0.027 3 NEWMAN, M 0.019 23662.824 0.026 4 BOGUNA, M 0.018 22915.094 0.025 5 MORENO, Y 0.016 19901.100 0.022 6 PASTORSATORRAS, R 0.014 17289.045 0.018 7 BOCCALETTI, S 0.014 17145.250 0.018 8 ARENAS, A 0.013 16799.965 0.018 9 STANLEY, H 0.013 16377.602 0.017 10 SOLE, R 0.011 14114.542 0.015 * Number of standard deviations from the mean of a random network of the same size and density
Mean: 0.000 Mean in random network: 0.001 Std.dev: 0.002 Std.dev in random network: 0.678 Hub centrality
A node is hub-central to the extent that its out-links are to nodes that have many in-links. Individuals or organizations that act as hubs are sending information to a wide range of others each of whom has many others reporting to them. Technically, an agent is hub-central if its out-links are to agents that have many other agents sending links to them. The scientific name of this measure is hub centrality and it is calculated on agent by agent matrices.
Input network(s): agent x agent
Rank Agent Value 1 BARABASI, A 0.862 2 JEONG, H 0.640 3 ALBERT, R 0.445 4 OLTVAI, Z 0.427 5 VICSEK, T 0.314 6 RAVASZ, E 0.309 7 NEDA, Z 0.207 8 YOOK, S 0.197 9 BIANCONI, G 0.157 10 FARKAS, I 0.139 Authority centrality
A node is authority-central to the extent that its in-links are from nodes that have many out-links. Individuals or organizations that act as authorities are receiving information from a wide range of others each of whom sends information to a large number of others. Technically, an agent is authority-central if its in-links are from agents that have are sending links to many others. The scientific name of this measure is authority centrality and it is calculated on agent by agent matrices.
Input network(s): agent x agent
Rank Agent Value 1 BARABASI, A 0.862 2 JEONG, H 0.640 3 ALBERT, R 0.445 4 OLTVAI, Z 0.427 5 VICSEK, T 0.314 6 RAVASZ, E 0.309 7 NEDA, Z 0.207 8 YOOK, S 0.197 9 BIANCONI, G 0.157 10 FARKAS, I 0.139 Information centrality
Calculate the Stephenson and Zelen information centrality measure for each node.
Input network(s): agent x agent
Rank Agent Value Unscaled 1 YUSTER, R 0.022 0.000 2 ALON, N 0.022 0.000 3 ZWICK, U 0.022 0.000 4 JOST, J 0.003 0.000 5 WENDE, A 0.003 0.000 6 ATAY, F 0.003 0.000 7 JOY, M 0.003 0.000 8 ALTER, O 0.003 0.000 9 BOTSTEIN, D 0.003 0.000 10 BROWN, P 0.003 0.000 Clique membership count
The number of distinct cliques to which each node belongs. Individuals or organizations who are high in number of cliques are those that belong to a large number of distinct cliques. A clique is defined as a group of three or more actors that have many connections to each other and relatively fewer connections to those in other groups. The scientific name of this measure is clique count and it is calculated on the agent by agent matrices.
Input network(s): agent x agent
Rank Agent Value 1 BARABASI, A 14.000 2 JEONG, H 12.000 3 NEWMAN, M 12.000 4 OLTVAI, Z 9.000 5 KAHNG, B 9.000 6 BOCCALETTI, S 8.000 7 MORENO, Y 8.000 8 DIAZGUILERA, A 7.000 9 PASTORSATORRAS, R 7.000 10 VESPIGNANI, A 7.000 Simmelian ties
The normalized number of Simmelian ties of each node.
Input network(s): agent x agent
Rank Agent Value Unscaled 1 BARABASI, A 0.020 32.000 2 JEONG, H 0.017 27.000 3 OLTVAI, Z 0.013 21.000 4 NEWMAN, M 0.013 21.000 5 YOUNG, M 0.013 20.000 6 UETZ, P 0.013 20.000 7 CAGNEY, G 0.013 20.000 8 MANSFIELD, T 0.013 20.000 9 ALON, U 0.012 19.000 10 GIOT, L 0.012 19.000 Clustering coefficient
Measures the degree of clustering in a network by averaging the clustering coefficient of each node, which is defined as the density of the node's ego network.
Input network(s): agent x agent
Rank Agent Value 1 ABRAMSON, G 1.000 2 ACEBRON, J 1.000 3 BONILLA, L 1.000 4 PEREZVICENTE, C 1.000 5 RITORT, F 1.000 6 SPIGLER, R 1.000 7 LUKOSE, R 1.000 8 PUNIYANI, A 1.000 9 GERSTEIN, G 1.000 10 HABIB, M 1.000
Key Nodes Table
This shows the top scoring nodes side-by-side for selected measures.
Rank Betweenness centrality Closeness centrality Eigenvector centrality Eigenvector centrality per component In-degree centrality In-Closeness centrality Out-degree centrality Total degree centrality 1 HOLME, P HOLME, P BARABASI, A BARABASI, A BARABASI, A HOLME, P BARABASI, A BARABASI, A 2 JEONG, H JEONG, H JEONG, H JEONG, H NEWMAN, M EDLING, C NEWMAN, M NEWMAN, M 3 NEWMAN, M EDLING, C ALBERT, R ALBERT, R JEONG, H LILJEROS, F JEONG, H JEONG, H 4 BOGUNA, M LILJEROS, F OLTVAI, Z OLTVAI, Z PASTORSATORRAS, R JEONG, H PASTORSATORRAS, R PASTORSATORRAS, R 5 MORENO, Y NEWMAN, M VICSEK, T VICSEK, T VESPIGNANI, A CHUNG, J VESPIGNANI, A VESPIGNANI, A 6 PASTORSATORRAS, R YOON, C RAVASZ, E RAVASZ, E SOLE, R NEWMAN, M SOLE, R SOLE, R 7 BOCCALETTI, S HAN, S NEDA, Z NEDA, Z MORENO, Y STANLEY, H MORENO, Y MORENO, Y 8 ARENAS, A STANLEY, H YOOK, S YOOK, S YOUNG, M MOSSA, S YOUNG, M YOUNG, M 9 STANLEY, H KIM, B BIANCONI, G BIANCONI, G BOCCALETTI, S CHOI, M BOCCALETTI, S BOCCALETTI, S 10 SOLE, R CHUNG, J FARKAS, I FARKAS, I LATORA, V YOON, C LATORA, V LATORA, V