Calculates common social network measures on each selected input network.
Analysis for the Meta-Network
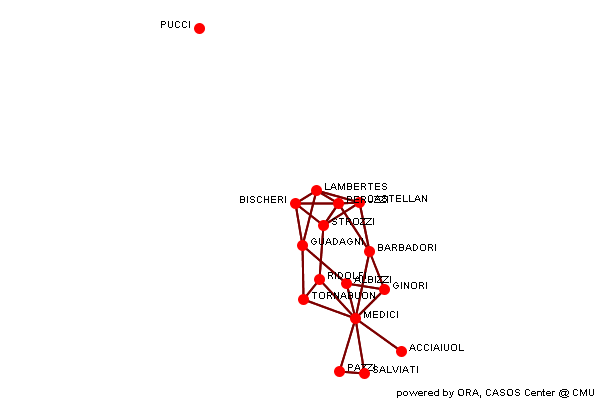
Individual entity classes have been combined into a single class, and all networks are combined to create a single network. If two networks connect the same entities, e.g. two agent x agent, then the links are combined. Link weights are made binary.
Row count 16 Column count 16 Link count 54 Density 0.225 Isolate count 1 Component count 2 Reciprocity 1 Characteristic path length 2.086 Clustering coefficient 0.4152 Network levels (diameter) 4 Network fragmentation 0.125 Krackhardt connectedness 0.875 Krackhardt efficiency 0.8571 Krackhardt hierarchy 0 Krackhardt upperboundedness 1 Degree centralization 0.3524 Betweenness centralization 0.3678 Closeness centralization 0.1717
Min Max Average Stddev Total degree centrality 0 0.5333 0.225 0.1152 Total degree centrality (unscaled) 0 16 6.75 3.455 Eigenvector centrality 0 1 0.6088 0.2727 Hub centrality 0 1 0.6088 0.2727 Authority centrality 0 1 0.6088 0.2727 Betweenness centrality 0 0.4127 0.06786 0.09843 Betweenness centrality (unscaled) 0 86.67 14.25 20.67 Information centrality 0 0.09243 0.0625 0.0207 Information centrality (unscaled) 0 1.815 1.227 0.4063 Clique membership count 0 5 1.875 1.364 Simmelian ties 0 0.4667 0.1917 0.1152 Simmelian ties (unscaled) 0 7 2.875 1.728 Clustering coefficient 0 1 0.4152 0.284 Key nodes
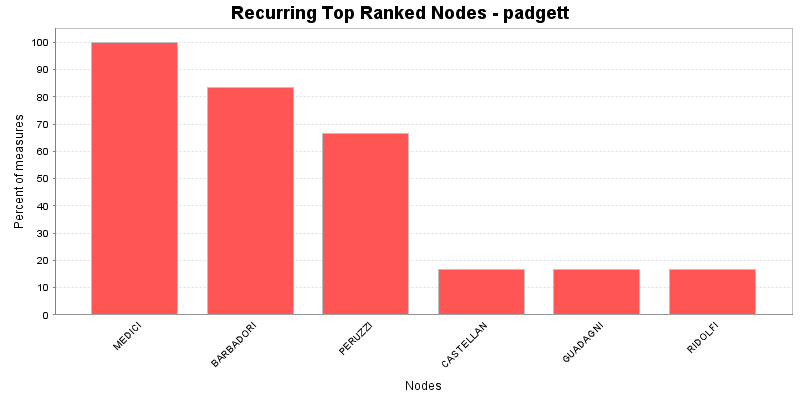
This chart shows the Nodes that repeatedly rank in the top three in the measures. The value shown is the percentage of measures for which the Nodes was ranked in the top three.
In-degree centrality
The In Degree Centrality of a node is its normalized in-degree.
Input network(s): meta-network
Rank Value Unscaled Nodes 1 0.533333 8 MEDICI 2 0.333333 5 PERUZZI 3 0.266667 4 BARBADORI 4 0.266667 4 BISCHERI 5 0.266667 4 CASTELLAN 6 0.266667 4 GUADAGNI 7 0.266667 4 LAMBERTES 8 0.266667 4 STROZZI 9 0.2 3 ALBIZZI 10 0.2 3 GINORI Out-degree centrality
The Out Degree Centrality of a node is its normalized out-degree.
Input network(s): meta-network
Rank Value Unscaled Nodes 1 0.533333 8 MEDICI 2 0.333333 5 PERUZZI 3 0.266667 4 BARBADORI 4 0.266667 4 BISCHERI 5 0.266667 4 CASTELLAN 6 0.266667 4 GUADAGNI 7 0.266667 4 LAMBERTES 8 0.266667 4 STROZZI 9 0.2 3 ALBIZZI 10 0.2 3 GINORI Total degree centrality
The Total Degree Centrality of a node is the normalized sum of its row and column degrees.
Input network(s): meta-network
Input network size: 16
Input network density: 0.225
Expected value from a random network of the same size and density: 0.225
Rank Value Unscaled Nodes Context* 1 0.533333 16 MEDICI 2.95351 2 0.333333 10 PERUZZI 1.03772 3 0.266667 8 BARBADORI 0.399123 4 0.266667 8 BISCHERI 0.399123 5 0.266667 8 CASTELLAN 0.399123 6 0.266667 8 GUADAGNI 0.399123 7 0.266667 8 LAMBERTES 0.399123 8 0.266667 8 STROZZI 0.399123 9 0.2 6 ALBIZZI -0.239474 10 0.2 6 GINORI -0.239474 * Number of standard deviations from the mean if links were distributed randomly Mean: 0.225 Std.dev: 0.104396 Eigenvector centrality
Calculates the principal eigenvector of the network. A node is central to the extent that its neighbors are central.
Input network(s): meta-network
Input network size: 16
Input network density: 0.225
Expected value from a random network of the same size and density: 0.480502
Rank Value Nodes Context* 1 1 PERUZZI 1.69028 2 0.954728 MEDICI 1.54297 3 0.842024 CASTELLAN 1.17627 4 0.827438 BARBADORI 1.12882 5 0.811606 LAMBERTES 1.0773 6 0.800749 BISCHERI 1.04198 7 0.786995 STROZZI 0.997226 8 0.659496 GUADAGNI 0.582388 9 0.569938 GINORI 0.290995 10 0.55936 RIDOLFI 0.256576 * Number of standard deviations from the mean if links were distributed randomly Mean: 0.480502 Std.dev: 0.307345 Betweenness centrality
The Betweenness Centrality of node v in a network is defined as: across all node pairs that have a shortest path containing v, the percentage that pass through v.
Input network(s): meta-network
Input network size: 16
Input network density: 0.225
Expected value from a random network of the same size and density: 0.0876378
Rank Value Unscaled Nodes Context* 1 0.412698 86.6667 MEDICI 5.88061 2 0.157936 33.1667 BARBADORI 1.27176 3 0.111905 23.5 GUADAGNI 0.439009 4 0.0706349 14.8333 RIDOLFI -0.307596 5 0.0611111 12.8333 PERUZZI -0.47989 6 0.0587302 12.3333 ALBIZZI -0.522963 7 0.0539683 11.3333 STROZZI -0.60911 8 0.0515873 10.8333 TORNABUON -0.652183 9 0.0325397 6.83333 CASTELLAN -0.99677 10 0.031746 6.66667 LAMBERTES -1.01113 * Number of standard deviations from the mean if links were distributed randomly Mean: 0.0876378 Std.dev: 0.0552767 Closeness centrality
The average closeness of a node to the other nodes in a network. Loosely, Closeness is the inverse of the average distance in the network between the node and all other nodes.
Input network(s): meta-network
Input network size: 16
Input network density: 0.225
Expected value from a random network of the same size and density: 0.465266
Rank Value Unscaled Nodes Context* 1 0.394737 0.0263158 MEDICI -1.11799 2 0.365854 0.0243902 BARBADORI -1.57582 3 0.357143 0.0238095 RIDOLFI -1.7139 4 0.348837 0.0232558 TORNABUON -1.84556 5 0.340909 0.0227273 ALBIZZI -1.97123 6 0.340909 0.0227273 GINORI -1.97123 7 0.340909 0.0227273 GUADAGNI -1.97123 8 0.340909 0.0227273 PERUZZI -1.97123 9 0.333333 0.0222222 CASTELLAN -2.09131 10 0.333333 0.0222222 STROZZI -2.09131 * Number of standard deviations from the mean if links were distributed randomly Mean: 0.465266 Std.dev: 0.0630863