Calculates common social network measures on each selected input network.
Network resource x resource
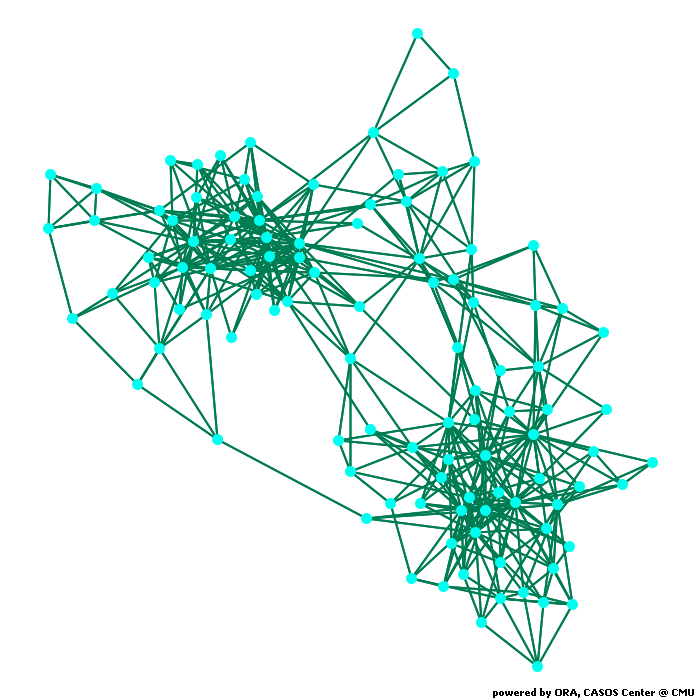
Network Level Measures
Measure Value Row count 105.000 Column count 105.000 Link count 441.000 Density 0.081 Components of 1 node (isolates) 0 Components of 2 nodes (dyadic isolates) 0 Components of 3 or more nodes 1 Reciprocity 1.000 Characteristic path length 3.079 Clustering coefficient 0.488 Network levels (diameter) 7.000 Network fragmentation 0.000 Krackhardt connectedness 1.000 Krackhardt efficiency 0.937 Krackhardt hierarchy 0.000 Krackhardt upperboundedness 1.000 Degree centralization 0.163 Betweenness centralization 0.120 Closeness centralization 0.172 Eigenvector centralization 0.094 Reciprocal (symmetric)? Yes
Node Level Measures
Measure Min Max Avg Stddev Total degree centrality 0.019 0.240 0.081 0.052 Total degree centrality [Unscaled] 2.000 25.000 8.400 5.449 In-degree centrality 0.019 0.240 0.081 0.052 In-degree centrality [Unscaled] 2.000 25.000 8.400 5.449 Out-degree centrality 0.019 0.240 0.081 0.052 Out-degree centrality [Unscaled] 2.000 25.000 8.400 5.449 Eigenvector centrality -0.420 -0.007 -0.099 0.096 Eigenvector centrality [Unscaled] -0.297 -0.005 -0.070 0.068 Eigenvector centrality per component -0.297 -0.005 -0.070 0.068 Closeness centrality 0.240 0.414 0.330 0.040 Closeness centrality [Unscaled] 0.002 0.004 0.003 0.000 In-Closeness centrality 0.240 0.414 0.330 0.040 In-Closeness centrality [Unscaled] 0.002 0.004 0.003 0.000 Betweenness centrality 0.000 0.139 0.020 0.029 Betweenness centrality [Unscaled] 0.000 747.046 108.095 154.839 Hub centrality 0.007 0.420 0.099 0.096 Authority centrality 0.007 0.420 0.099 0.096 Information centrality 0.004 0.013 0.010 0.002 Information centrality [Unscaled] 0.993 3.391 2.402 0.519 Clique membership count 0.000 36.000 6.848 7.534 Simmelian ties 0.000 0.240 0.077 0.054 Simmelian ties [Unscaled] 0.000 25.000 8.057 5.580 Clustering coefficient 0.000 1.000 0.488 0.215
Key Nodes
This chart shows the Resource that is repeatedly top-ranked in the measures listed below. The value shown is the percentage of measures for which the Resource was ranked in the top three.

Total degree centrality
The Total Degree Centrality of a node is the normalized sum of its row and column degrees. Individuals or organizations who are "in the know" are those who are linked to many others and so, by virtue of their position have access to the ideas, thoughts, beliefs of many others. Individuals who are "in the know" are identified by degree centrality in the relevant social network. Those who are ranked high on this metrics have more connections to others in the same network. The scientific name of this measure is total degree centrality and it is calculated on the agent by agent matrices.
Input network: resource x resource (size: 105, density: 0.0807692)
Rank Resource Value Unscaled Context* 1 A National Party No More 0.240 25.000 6.003 2 Off with Their Heads 0.240 25.000 6.003 3 Losing Bin Laden 0.221 23.000 5.279 4 Bushwhacked 0.221 23.000 5.279 5 American Dynasty 0.212 22.000 4.918 6 The Great Unraveling 0.202 21.000 4.556 7 Big Lies 0.202 21.000 4.556 8 The Price of Loyalty 0.192 20.000 4.195 9 Legacy 0.173 18.000 3.471 10 Deliver Us from Evil 0.173 18.000 3.471 * Number of standard deviations from the mean of a random network of the same size and density
Mean: 0.081 Mean in random network: 0.081 Std.dev: 0.052 Std.dev in random network: 0.027 In-degree centrality
The In Degree Centrality of a node is its normalized in-degree. For any node, e.g. an individual or a resource, the in-links are the connections that the node of interest receives from other nodes. For example, imagine an agent by knowledge matrix then the number of in-links a piece of knowledge has is the number of agents that are connected to. The scientific name of this measure is in-degree and it is calculated on the agent by agent matrices.
Input network(s): resource x resource
Rank Resource Value Unscaled 1 A National Party No More 0.240 25.000 2 Off with Their Heads 0.240 25.000 3 Losing Bin Laden 0.221 23.000 4 Bushwhacked 0.221 23.000 5 American Dynasty 0.212 22.000 6 The Great Unraveling 0.202 21.000 7 Big Lies 0.202 21.000 8 The Price of Loyalty 0.192 20.000 9 Legacy 0.173 18.000 10 Deliver Us from Evil 0.173 18.000 Out-degree centrality
For any node, e.g. an individual or a resource, the out-links are the connections that the node of interest sends to other nodes. For example, imagine an agent by knowledge matrix then the number of out-links an agent would have is the number of pieces of knowledge it is connected to. The scientific name of this measure is out-degree and it is calculated on the agent by agent matrices. Individuals or organizations who are high in most knowledge have more expertise or are associated with more types of knowledge than are others. If no sub-network connecting agents to knowledge exists, then this measure will not be calculated. The scientific name of this measure is out degree centrality and it is calculated on agent by knowledge matrices. Individuals or organizations who are high in "most resources" have more resources or are associated with more types of resources than are others. If no sub-network connecting agents to resources exists, then this measure will not be calculated. The scientific name of this measure is out degree centrality and it is calculated on agent by resource matrices.
Input network(s): resource x resource
Rank Resource Value Unscaled 1 A National Party No More 0.240 25.000 2 Off with Their Heads 0.240 25.000 3 Losing Bin Laden 0.221 23.000 4 Bushwhacked 0.221 23.000 5 American Dynasty 0.212 22.000 6 The Great Unraveling 0.202 21.000 7 Big Lies 0.202 21.000 8 The Price of Loyalty 0.192 20.000 9 Legacy 0.173 18.000 10 Deliver Us from Evil 0.173 18.000 Eigenvector centrality
Calculates the principal eigenvector of the network. A node is central to the extent that its neighbors are central. Leaders of strong cliques are individuals who or organizations who are collected to others that are themselves highly connected to each other. In other words, if you have a clique then the individual most connected to others in the clique and other cliques, is the leader of the clique. Individuals or organizations who are connected to many otherwise isolated individuals or organizations will have a much lower score in this measure then those that are connected to groups that have many connections themselves. The scientific name of this measure is eigenvector centrality and it is calculated on agent by agent matrices.
Input network: resource x resource (size: 105, density: 0.0807692)
Rank Resource Value Unscaled Context* 1 The Future of Freedom -0.007 -0.005 -2.223 2 Empire -0.008 -0.006 -2.229 3 The O'Reilly Factor -0.015 -0.010 -2.258 4 We Will Prevail -0.015 -0.010 -2.258 5 Charlie Wilson's War -0.017 -0.012 -2.266 6 Bush vs. the Beltway -0.017 -0.012 -2.269 7 Betrayal -0.017 -0.012 -2.269 8 Colossus -0.019 -0.013 -2.276 9 Fighting Back -0.021 -0.015 -2.284 10 The Faith of George W Bush -0.023 -0.016 -2.293 * Number of standard deviations from the mean of a random network of the same size and density
Mean: -0.099 Mean in random network: 0.517 Std.dev: 0.096 Std.dev in random network: 0.235 Eigenvector centrality per component
Calculates the principal eigenvector of the network. A node is central to the extent that its neighbors are central. Each component is extracted as a separate network, Eigenvector Centrality is computed on it and scaled according to the component size. The scores are then combined into a single result vector.
Input network(s): resource x resource
Rank Resource Value 1 The Future of Freedom -0.005 2 Empire -0.006 3 The O'Reilly Factor -0.010 4 We Will Prevail -0.010 5 Charlie Wilson's War -0.012 6 Bush vs. the Beltway -0.012 7 Betrayal -0.012 8 Colossus -0.013 9 Fighting Back -0.015 10 The Faith of George W Bush -0.016 Closeness centrality
The average closeness of a node to the other nodes in a network (also called out-closeness). Loosely, Closeness is the inverse of the average distance in the network from the node to all other nodes.
Input network: resource x resource (size: 105, density: 0.0807692)
Rank Resource Value Unscaled Context* 1 The Price of Loyalty 0.414 0.004 0.995 2 Rise of the Vulcans 0.413 0.004 0.955 3 Ghost Wars 0.408 0.004 0.838 4 The Bushes 0.408 0.004 0.838 5 Bush Country 0.406 0.004 0.800 6 Plan of Attack 0.397 0.004 0.576 7 Rumsfeld's War 0.395 0.004 0.539 8 American Dynasty 0.394 0.004 0.503 9 Sleeping With the Devil 0.391 0.004 0.432 10 House of Bush, House of Saud 0.382 0.004 0.224 * Number of standard deviations from the mean of a random network of the same size and density
Mean: 0.330 Mean in random network: 0.373 Std.dev: 0.040 Std.dev in random network: 0.042 In-Closeness centrality
The average closeness of a node from the other nodes in a network. Loosely, Closeness is the inverse of the average distance in the network to the node and from all other nodes.
Input network(s): resource x resource
Rank Resource Value Unscaled 1 The Price of Loyalty 0.414 0.004 2 Rise of the Vulcans 0.413 0.004 3 Ghost Wars 0.408 0.004 4 The Bushes 0.408 0.004 5 Bush Country 0.406 0.004 6 Plan of Attack 0.397 0.004 7 Rumsfeld's War 0.395 0.004 8 American Dynasty 0.394 0.004 9 Sleeping With the Devil 0.391 0.004 10 House of Bush, House of Saud 0.382 0.004 Betweenness centrality
The Betweenness Centrality of node v in a network is defined as: across all node pairs that have a shortest path containing v, the percentage that pass through v. Individuals or organizations that are potentially influential are positioned to broker connections between groups and to bring to bear the influence of one group on another or serve as a gatekeeper between groups. This agent occurs on many of the shortest paths between other agents. The scientific name of this measure is betweenness centrality and it is calculated on agent by agent matrices.
Input network: resource x resource (size: 105, density: 0.0807692)
Rank Resource Value Unscaled Context* 1 The Price of Loyalty 0.139 747.046 1.383 2 The Bushes 0.104 555.145 0.977 3 Bush Country 0.098 527.003 0.918 4 Off with Their Heads 0.095 510.221 0.882 5 American Dynasty 0.091 487.044 0.833 6 Plan of Attack 0.080 430.098 0.712 7 Losing Bin Laden 0.076 407.553 0.665 8 Rise of the Vulcans 0.075 403.156 0.655 9 A National Party No More 0.075 401.205 0.651 10 Ghost Wars 0.069 368.088 0.581 * Number of standard deviations from the mean of a random network of the same size and density
Mean: 0.020 Mean in random network: 0.017 Std.dev: 0.029 Std.dev in random network: 0.088 Hub centrality
A node is hub-central to the extent that its out-links are to nodes that have many in-links. Individuals or organizations that act as hubs are sending information to a wide range of others each of whom has many others reporting to them. Technically, an agent is hub-central if its out-links are to agents that have many other agents sending links to them. The scientific name of this measure is hub centrality and it is calculated on agent by agent matrices.
Input network(s): resource x resource
Rank Resource Value 1 Bushwhacked 0.420 2 Big Lies 0.402 3 American Dynasty 0.383 4 The Price of Loyalty 0.366 5 The Great Unraveling 0.360 6 The Lies of George W. Bush 0.342 7 Worse Than Watergate 0.336 8 Plan of Attack 0.280 9 Lies and the Lying Liars Who Tell Them 0.268 10 Against All Enemies 0.264 Authority centrality
A node is authority-central to the extent that its in-links are from nodes that have many out-links. Individuals or organizations that act as authorities are receiving information from a wide range of others each of whom sends information to a large number of others. Technically, an agent is authority-central if its in-links are from agents that have are sending links to many others. The scientific name of this measure is authority centrality and it is calculated on agent by agent matrices.
Input network(s): resource x resource
Rank Resource Value 1 Bushwhacked 0.420 2 Big Lies 0.402 3 American Dynasty 0.383 4 The Price of Loyalty 0.366 5 The Great Unraveling 0.360 6 The Lies of George W. Bush 0.342 7 Worse Than Watergate 0.336 8 Plan of Attack 0.280 9 Lies and the Lying Liars Who Tell Them 0.268 10 Against All Enemies 0.264 Information centrality
Calculate the Stephenson and Zelen information centrality measure for each node.
Input network(s): resource x resource
Rank Resource Value Unscaled 1 Losing Bin Laden 0.013 3.391 2 The Price of Loyalty 0.013 3.389 3 A National Party No More 0.013 3.382 4 Off with Their Heads 0.013 3.379 5 American Dynasty 0.013 3.338 6 The Great Unraveling 0.013 3.324 7 Bushwhacked 0.013 3.284 8 Big Lies 0.013 3.261 9 Legacy 0.013 3.242 10 Bush Country 0.013 3.237 Clique membership count
The number of distinct cliques to which each node belongs. Individuals or organizations who are high in number of cliques are those that belong to a large number of distinct cliques. A clique is defined as a group of three or more actors that have many connections to each other and relatively fewer connections to those in other groups. The scientific name of this measure is clique count and it is calculated on the agent by agent matrices.
Input network(s): resource x resource
Rank Resource Value 1 A National Party No More 36.000 2 Off with Their Heads 32.000 3 Bushwhacked 32.000 4 The Great Unraveling 25.000 5 Big Lies 24.000 6 Worse Than Watergate 24.000 7 Deliver Us from Evil 23.000 8 American Dynasty 23.000 9 Losing Bin Laden 22.000 10 Arrogance 21.000 Simmelian ties
The normalized number of Simmelian ties of each node.
Input network(s): resource x resource
Rank Resource Value Unscaled 1 A National Party No More 0.240 25.000 2 Off with Their Heads 0.240 25.000 3 Losing Bin Laden 0.221 23.000 4 Bushwhacked 0.221 23.000 5 American Dynasty 0.212 22.000 6 The Great Unraveling 0.202 21.000 7 Big Lies 0.202 21.000 8 The Price of Loyalty 0.192 20.000 9 Deliver Us from Evil 0.173 18.000 10 Arrogance 0.173 18.000 Clustering coefficient
Measures the degree of clustering in a network by averaging the clustering coefficient of each node, which is defined as the density of the node's ego network.
Input network(s): resource x resource
Rank Resource Value 1 Betrayal 1.000 2 The Culture of Fear 1.000 3 Freethinkers 1.000 4 The Future of Freedom 1.000 5 Shut Up and Sing 0.900 6 The Buying of the President 2004 0.900 7 Perfectly Legal 0.867 8 Bush vs. the Beltway 0.833 9 The Perfect Wife 0.833 10 Hillary's Scheme 0.800
Key Nodes Table
This shows the top scoring nodes side-by-side for selected measures.
Rank Betweenness centrality Closeness centrality Eigenvector centrality Eigenvector centrality per component In-degree centrality In-Closeness centrality Out-degree centrality Total degree centrality 1 The Price of Loyalty The Price of Loyalty The Future of Freedom The Future of Freedom A National Party No More The Price of Loyalty A National Party No More A National Party No More 2 The Bushes Rise of the Vulcans Empire Empire Off with Their Heads Rise of the Vulcans Off with Their Heads Off with Their Heads 3 Bush Country Ghost Wars The O'Reilly Factor The O'Reilly Factor Losing Bin Laden Ghost Wars Losing Bin Laden Losing Bin Laden 4 Off with Their Heads The Bushes We Will Prevail We Will Prevail Bushwhacked The Bushes Bushwhacked Bushwhacked 5 American Dynasty Bush Country Charlie Wilson's War Charlie Wilson's War American Dynasty Bush Country American Dynasty American Dynasty 6 Plan of Attack Plan of Attack Bush vs. the Beltway Bush vs. the Beltway The Great Unraveling Plan of Attack The Great Unraveling The Great Unraveling 7 Losing Bin Laden Rumsfeld's War Betrayal Betrayal Big Lies Rumsfeld's War Big Lies Big Lies 8 Rise of the Vulcans American Dynasty Colossus Colossus The Price of Loyalty American Dynasty The Price of Loyalty The Price of Loyalty 9 A National Party No More Sleeping With the Devil Fighting Back Fighting Back Legacy Sleeping With the Devil Legacy Legacy 10 Ghost Wars House of Bush, House of Saud The Faith of George W Bush The Faith of George W Bush Deliver Us from Evil House of Bush, House of Saud Deliver Us from Evil Deliver Us from Evil