Calculates common social network measures on each selected input network.
Network
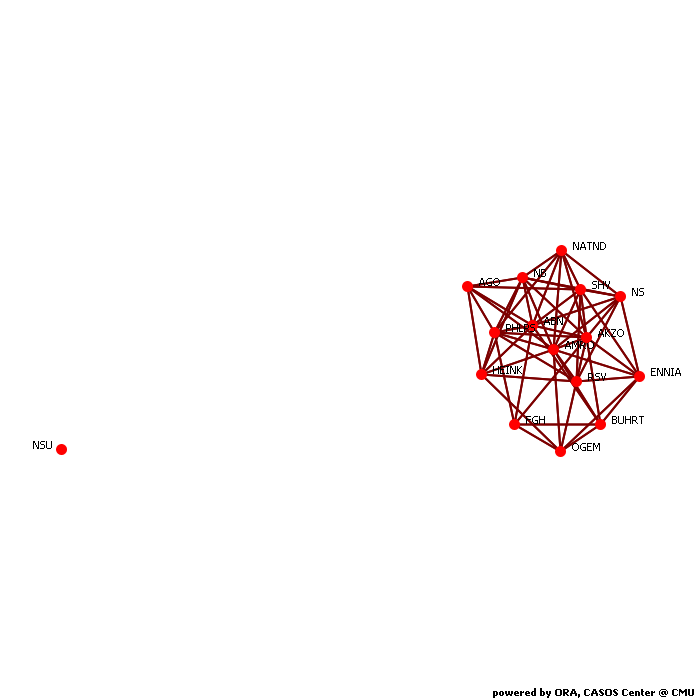
Network Level Measures
Measure Value Row count 16.000 Column count 16.000 Link count 60.000 Density 0.500 Components of 1 node (isolates) 1 Components of 2 nodes (dyadic isolates) 0 Components of 3 or more nodes 1 Reciprocity 1.000 Characteristic path length 1.629 Clustering coefficient 0.604 Network levels (diameter) 3.000 Network fragmentation 0.125 Krackhardt connectedness 0.875 Krackhardt efficiency 0.495 Krackhardt hierarchy 0.000 Krackhardt upperboundedness 1.000 Degree centralization 0.221 Betweenness centralization 0.081 Closeness centralization 0.039 Eigenvector centralization 0.335 Reciprocal (symmetric)? Yes
Node Level Measures
Measure Min Max Avg Stddev Total degree centrality 0.000 0.367 0.173 0.080 Total degree centrality [Unscaled] 0.000 22.000 10.375 4.781 In-degree centrality 0.000 0.367 0.173 0.080 In-degree centrality [Unscaled] 0.000 22.000 10.375 4.781 Out-degree centrality 0.000 0.367 0.173 0.080 Out-degree centrality [Unscaled] 0.000 22.000 10.375 4.781 Eigenvector centrality 0.000 0.616 0.323 0.144 Eigenvector centrality [Unscaled] 0.000 0.436 0.228 0.102 Eigenvector centrality per component 0.000 0.409 0.214 0.095 Closeness centrality 0.016 0.181 0.163 0.038 Closeness centrality [Unscaled] 0.001 0.012 0.011 0.003 In-Closeness centrality 0.016 0.181 0.163 0.038 In-Closeness centrality [Unscaled] 0.001 0.012 0.011 0.003 Betweenness centrality 0.000 0.111 0.035 0.031 Betweenness centrality [Unscaled] 0.000 11.692 3.715 3.248 Hub centrality 0.000 0.616 0.323 0.144 Authority centrality 0.000 0.616 0.323 0.144 Information centrality 0.000 0.091 0.063 0.020 Information centrality [Unscaled] 0.000 7.439 5.119 1.614 Clique membership count 0.000 11.000 5.063 2.561 Simmelian ties 0.000 0.800 0.500 0.180 Simmelian ties [Unscaled] 0.000 12.000 7.500 2.693 Clustering coefficient 0.000 0.857 0.604 0.184
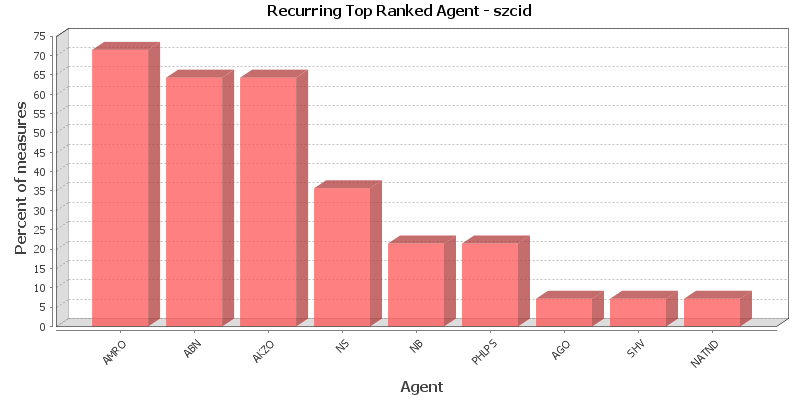
Key Nodes
This chart shows the Agent that is repeatedly top-ranked in the measures listed below. The value shown is the percentage of measures for which the Agent was ranked in the top three.
Total degree centrality
The Total Degree Centrality of a node is the normalized sum of its row and column degrees. Individuals or organizations who are "in the know" are those who are linked to many others and so, by virtue of their position have access to the ideas, thoughts, beliefs of many others. Individuals who are "in the know" are identified by degree centrality in the relevant social network. Those who are ranked high on this metrics have more connections to others in the same network. The scientific name of this measure is total degree centrality and it is calculated on the agent by agent matrices.
Input network: agent x agent (size: 16, density: 0.5)
Rank Agent Value Unscaled Context* 1 AMRO 0.367 22.000 -1.067 2 ABN 0.267 16.000 -1.867 3 AKZO 0.233 14.000 -2.133 4 NS 0.217 13.000 -2.267 5 SHV 0.200 12.000 -2.400 6 ENNIA 0.183 11.000 -2.533 7 NB 0.183 11.000 -2.533 8 NATND 0.183 11.000 -2.533 9 RSV 0.183 11.000 -2.533 10 HEINK 0.167 10.000 -2.667 * Number of standard deviations from the mean of a random network of the same size and density
Mean: 0.173 Mean in random network: 0.500 Std.dev: 0.080 Std.dev in random network: 0.125 In-degree centrality
The In Degree Centrality of a node is its normalized in-degree. For any node, e.g. an individual or a resource, the in-links are the connections that the node of interest receives from other nodes. For example, imagine an agent by knowledge matrix then the number of in-links a piece of knowledge has is the number of agents that are connected to. The scientific name of this measure is in-degree and it is calculated on the agent by agent matrices.
Input network(s): agent x agent
Rank Agent Value Unscaled 1 AMRO 0.367 22.000 2 ABN 0.267 16.000 3 AKZO 0.233 14.000 4 NS 0.217 13.000 5 SHV 0.200 12.000 6 ENNIA 0.183 11.000 7 NB 0.183 11.000 8 NATND 0.183 11.000 9 RSV 0.183 11.000 10 HEINK 0.167 10.000 Out-degree centrality
For any node, e.g. an individual or a resource, the out-links are the connections that the node of interest sends to other nodes. For example, imagine an agent by knowledge matrix then the number of out-links an agent would have is the number of pieces of knowledge it is connected to. The scientific name of this measure is out-degree and it is calculated on the agent by agent matrices. Individuals or organizations who are high in most knowledge have more expertise or are associated with more types of knowledge than are others. If no sub-network connecting agents to knowledge exists, then this measure will not be calculated. The scientific name of this measure is out degree centrality and it is calculated on agent by knowledge matrices. Individuals or organizations who are high in "most resources" have more resources or are associated with more types of resources than are others. If no sub-network connecting agents to resources exists, then this measure will not be calculated. The scientific name of this measure is out degree centrality and it is calculated on agent by resource matrices.
Input network(s): agent x agent
Rank Agent Value Unscaled 1 AMRO 0.367 22.000 2 ABN 0.267 16.000 3 AKZO 0.233 14.000 4 NS 0.217 13.000 5 SHV 0.200 12.000 6 ENNIA 0.183 11.000 7 NB 0.183 11.000 8 NATND 0.183 11.000 9 RSV 0.183 11.000 10 HEINK 0.167 10.000 Eigenvector centrality
Calculates the principal eigenvector of the network. A node is central to the extent that its neighbors are central. Leaders of strong cliques are individuals who or organizations who are collected to others that are themselves highly connected to each other. In other words, if you have a clique then the individual most connected to others in the clique and other cliques, is the leader of the clique. Individuals or organizations who are connected to many otherwise isolated individuals or organizations will have a much lower score in this measure then those that are connected to groups that have many connections themselves. The scientific name of this measure is eigenvector centrality and it is calculated on agent by agent matrices.
Input network: agent x agent (size: 16, density: 0.5)
Rank Agent Value Unscaled Context* 1 AMRO 0.616 0.436 -0.254 2 NS 0.444 0.314 -0.942 3 ABN 0.429 0.303 -1.001 4 AKZO 0.417 0.295 -1.050 5 SHV 0.414 0.293 -1.063 6 NATND 0.390 0.275 -1.159 7 ENNIA 0.381 0.269 -1.193 8 RSV 0.362 0.256 -1.268 9 NB 0.359 0.254 -1.281 10 HEINK 0.332 0.235 -1.390 * Number of standard deviations from the mean of a random network of the same size and density
Mean: 0.323 Mean in random network: 0.680 Std.dev: 0.144 Std.dev in random network: 0.250 Eigenvector centrality per component
Calculates the principal eigenvector of the network. A node is central to the extent that its neighbors are central. Each component is extracted as a separate network, Eigenvector Centrality is computed on it and scaled according to the component size. The scores are then combined into a single result vector.
Input network(s): agent x agent
Rank Agent Value 1 AMRO 0.409 2 NS 0.294 3 ABN 0.284 4 AKZO 0.276 5 SHV 0.274 6 NATND 0.258 7 ENNIA 0.253 8 RSV 0.240 9 NB 0.238 10 HEINK 0.220 Closeness centrality
The average closeness of a node to the other nodes in a network (also called out-closeness). Loosely, Closeness is the inverse of the average distance in the network from the node to all other nodes.
Input network: agent x agent (size: 16, density: 0.5)
Rank Agent Value Unscaled Context* 1 PHLPS 0.181 0.012 -8.093 2 AKZO 0.179 0.012 -8.129 3 NB 0.176 0.012 -8.164 4 ABN 0.174 0.012 -8.198 5 SHV 0.174 0.012 -8.198 6 ENNIA 0.172 0.011 -8.232 7 FGH 0.172 0.011 -8.232 8 HEINK 0.172 0.011 -8.232 9 RSV 0.172 0.011 -8.232 10 AMRO 0.170 0.011 -8.264 * Number of standard deviations from the mean of a random network of the same size and density
Mean: 0.163 Mean in random network: 0.667 Std.dev: 0.038 Std.dev in random network: 0.060 In-Closeness centrality
The average closeness of a node from the other nodes in a network. Loosely, Closeness is the inverse of the average distance in the network to the node and from all other nodes.
Input network(s): agent x agent
Rank Agent Value Unscaled 1 PHLPS 0.181 0.012 2 AKZO 0.179 0.012 3 NB 0.176 0.012 4 ABN 0.174 0.012 5 SHV 0.174 0.012 6 ENNIA 0.172 0.011 7 FGH 0.172 0.011 8 HEINK 0.172 0.011 9 RSV 0.172 0.011 10 AMRO 0.170 0.011 Betweenness centrality
The Betweenness Centrality of node v in a network is defined as: across all node pairs that have a shortest path containing v, the percentage that pass through v. Individuals or organizations that are potentially influential are positioned to broker connections between groups and to bring to bear the influence of one group on another or serve as a gatekeeper between groups. This agent occurs on many of the shortest paths between other agents. The scientific name of this measure is betweenness centrality and it is calculated on agent by agent matrices.
Input network: agent x agent (size: 16, density: 0.5)
Rank Agent Value Unscaled Context* 1 PHLPS 0.111 11.692 1.643 2 AKZO 0.100 10.458 1.369 3 SHV 0.056 5.908 0.357 4 OGEM 0.046 4.875 0.128 5 ABN 0.044 4.608 0.068 6 NB 0.040 4.192 -0.024 7 HEINK 0.034 3.533 -0.171 8 ENNIA 0.031 3.250 -0.234 9 FGH 0.030 3.200 -0.245 10 RSV 0.025 2.575 -0.384 * Number of standard deviations from the mean of a random network of the same size and density
Mean: 0.035 Mean in random network: 0.041 Std.dev: 0.031 Std.dev in random network: 0.043 Hub centrality
A node is hub-central to the extent that its out-links are to nodes that have many in-links. Individuals or organizations that act as hubs are sending information to a wide range of others each of whom has many others reporting to them. Technically, an agent is hub-central if its out-links are to agents that have many other agents sending links to them. The scientific name of this measure is hub centrality and it is calculated on agent by agent matrices.
Input network(s): agent x agent
Rank Agent Value 1 AMRO 0.616 2 NS 0.444 3 ABN 0.429 4 AKZO 0.417 5 SHV 0.414 6 NATND 0.390 7 ENNIA 0.381 8 RSV 0.362 9 NB 0.359 10 HEINK 0.332 Authority centrality
A node is authority-central to the extent that its in-links are from nodes that have many out-links. Individuals or organizations that act as authorities are receiving information from a wide range of others each of whom sends information to a large number of others. Technically, an agent is authority-central if its in-links are from agents that have are sending links to many others. The scientific name of this measure is authority centrality and it is calculated on agent by agent matrices.
Input network(s): agent x agent
Rank Agent Value 1 AMRO 0.616 2 NS 0.444 3 ABN 0.429 4 AKZO 0.417 5 SHV 0.414 6 NATND 0.390 7 ENNIA 0.381 8 RSV 0.362 9 NB 0.359 10 HEINK 0.332 Information centrality
Calculate the Stephenson and Zelen information centrality measure for each node.
Input network(s): agent x agent
Rank Agent Value Unscaled 1 AMRO 0.091 7.439 2 ABN 0.080 6.583 3 AKZO 0.078 6.372 4 NS 0.073 5.957 5 SHV 0.072 5.861 6 RSV 0.069 5.644 7 NB 0.069 5.621 8 NATND 0.068 5.539 9 ENNIA 0.067 5.528 10 HEINK 0.066 5.392 Clique membership count
The number of distinct cliques to which each node belongs. Individuals or organizations who are high in number of cliques are those that belong to a large number of distinct cliques. A clique is defined as a group of three or more actors that have many connections to each other and relatively fewer connections to those in other groups. The scientific name of this measure is clique count and it is calculated on the agent by agent matrices.
Input network(s): agent x agent
Rank Agent Value 1 AMRO 11.000 2 AKZO 9.000 3 NB 8.000 4 PHLPS 7.000 5 ABN 6.000 6 SHV 5.000 7 RSV 5.000 8 ENNIA 4.000 9 BUHRT 4.000 10 AGO 4.000 Simmelian ties
The normalized number of Simmelian ties of each node.
Input network(s): agent x agent
Rank Agent Value Unscaled 1 AMRO 0.800 12.000 2 AKZO 0.733 11.000 3 ABN 0.667 10.000 4 NB 0.600 9.000 5 SHV 0.600 9.000 6 PHLPS 0.600 9.000 7 NS 0.533 8.000 8 RSV 0.533 8.000 9 ENNIA 0.467 7.000 10 HEINK 0.467 7.000 Clustering coefficient
Measures the degree of clustering in a network by averaging the clustering coefficient of each node, which is defined as the density of the node's ego network.
Input network(s): agent x agent
Rank Agent Value 1 NATND 0.857 2 AGO 0.800 3 NS 0.750 4 NB 0.722 5 ENNIA 0.714 6 SHV 0.667 7 HEINK 0.619 8 RSV 0.607 9 BUHRT 0.600 10 FGH 0.600
Key Nodes Table
This shows the top scoring nodes side-by-side for selected measures.
Rank Betweenness centrality Closeness centrality Eigenvector centrality Eigenvector centrality per component In-degree centrality In-Closeness centrality Out-degree centrality Total degree centrality 1 PHLPS PHLPS AMRO AMRO AMRO PHLPS AMRO AMRO 2 AKZO AKZO NS NS ABN AKZO ABN ABN 3 SHV NB ABN ABN AKZO NB AKZO AKZO 4 OGEM ABN AKZO AKZO NS ABN NS NS 5 ABN SHV SHV SHV SHV SHV SHV SHV 6 NB ENNIA NATND NATND ENNIA ENNIA ENNIA ENNIA 7 HEINK FGH ENNIA ENNIA NB FGH NB NB 8 ENNIA HEINK RSV RSV NATND HEINK NATND NATND 9 FGH RSV NB NB RSV RSV RSV RSV 10 RSV AMRO HEINK HEINK HEINK AMRO HEINK HEINK