Calculates common social network measures on each selected input network.
Network
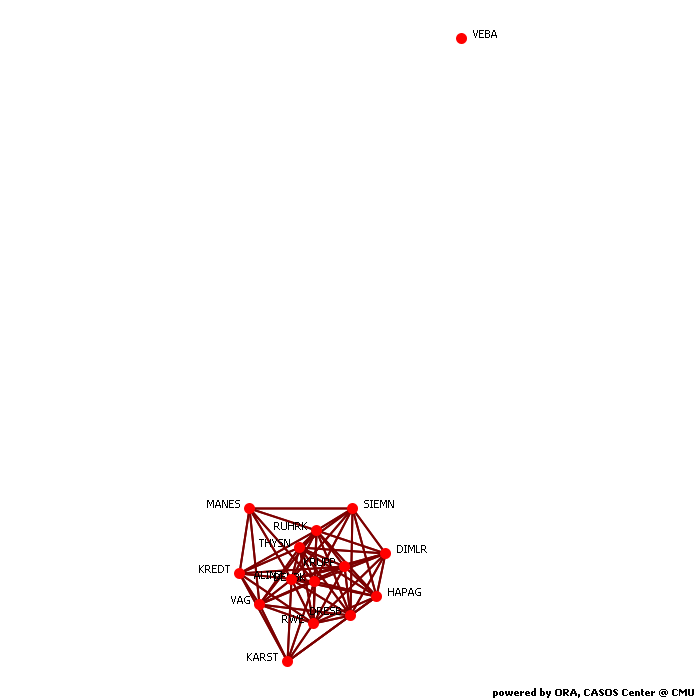
Network Level Measures
Measure Value Row count 15.000 Column count 15.000 Link count 67.000 Density 0.638 Components of 1 node (isolates) 1 Components of 2 nodes (dyadic isolates) 0 Components of 3 or more nodes 1 Reciprocity 1.000 Characteristic path length 1.692 Clustering coefficient 0.722 Network levels (diameter) 3.000 Network fragmentation 0.133 Krackhardt connectedness 0.867 Krackhardt efficiency 0.308 Krackhardt hierarchy 0.000 Krackhardt upperboundedness 1.000 Degree centralization 0.117 Betweenness centralization 0.118 Closeness centralization 0.027 Eigenvector centralization 0.229 Reciprocal (symmetric)? Yes
Node Level Measures
Measure Min Max Avg Stddev Total degree centrality 0.000 0.286 0.184 0.075 Total degree centrality [Unscaled] 0.000 24.000 15.467 6.334 In-degree centrality 0.000 0.286 0.184 0.075 In-degree centrality [Unscaled] 0.000 24.000 15.467 6.334 Out-degree centrality 0.000 0.286 0.184 0.075 Out-degree centrality [Unscaled] 0.000 24.000 15.467 6.334 Eigenvector centrality 0.000 0.535 0.337 0.141 Eigenvector centrality [Unscaled] 0.000 0.379 0.238 0.100 Eigenvector centrality per component 0.000 0.353 0.222 0.093 Closeness centrality 0.011 0.130 0.117 0.029 Closeness centrality [Unscaled] 0.001 0.009 0.008 0.002 In-Closeness centrality 0.011 0.130 0.117 0.029 In-Closeness centrality [Unscaled] 0.001 0.009 0.008 0.002 Betweenness centrality 0.000 0.147 0.037 0.046 Betweenness centrality [Unscaled] 0.000 13.421 3.410 4.173 Hub centrality 0.000 0.535 0.337 0.141 Authority centrality 0.000 0.535 0.337 0.141 Information centrality 0.000 0.086 0.067 0.021 Information centrality [Unscaled] 0.000 10.479 8.154 2.544 Clique membership count 0.000 12.000 6.267 3.530 Simmelian ties 0.000 0.857 0.638 0.209 Simmelian ties [Unscaled] 0.000 12.000 8.933 2.932 Clustering coefficient 0.000 0.889 0.722 0.199
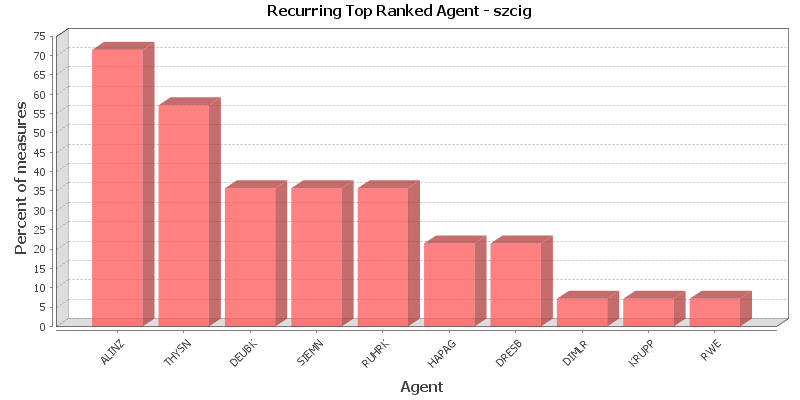
Key Nodes
This chart shows the Agent that is repeatedly top-ranked in the measures listed below. The value shown is the percentage of measures for which the Agent was ranked in the top three.
Total degree centrality
The Total Degree Centrality of a node is the normalized sum of its row and column degrees. Individuals or organizations who are "in the know" are those who are linked to many others and so, by virtue of their position have access to the ideas, thoughts, beliefs of many others. Individuals who are "in the know" are identified by degree centrality in the relevant social network. Those who are ranked high on this metrics have more connections to others in the same network. The scientific name of this measure is total degree centrality and it is calculated on the agent by agent matrices.
Input network: agent x agent (size: 15, density: 0.638095)
Rank Agent Value Unscaled Context* 1 ALINZ 0.286 24.000 -2.840 2 DEUBK 0.274 23.000 -2.936 3 THYSN 0.274 23.000 -2.936 4 SIEMN 0.262 22.000 -3.032 5 RWE 0.238 20.000 -3.224 6 DIMLR 0.202 17.000 -3.512 7 VAG 0.190 16.000 -3.608 8 RUHRK 0.190 16.000 -3.608 9 KRUPP 0.179 15.000 -3.704 10 HAPAG 0.155 13.000 -3.895 * Number of standard deviations from the mean of a random network of the same size and density
Mean: 0.184 Mean in random network: 0.638 Std.dev: 0.075 Std.dev in random network: 0.124 In-degree centrality
The In Degree Centrality of a node is its normalized in-degree. For any node, e.g. an individual or a resource, the in-links are the connections that the node of interest receives from other nodes. For example, imagine an agent by knowledge matrix then the number of in-links a piece of knowledge has is the number of agents that are connected to. The scientific name of this measure is in-degree and it is calculated on the agent by agent matrices.
Input network(s): agent x agent
Rank Agent Value Unscaled 1 ALINZ 0.286 24.000 2 DEUBK 0.274 23.000 3 THYSN 0.274 23.000 4 SIEMN 0.262 22.000 5 RWE 0.238 20.000 6 DIMLR 0.202 17.000 7 VAG 0.190 16.000 8 RUHRK 0.190 16.000 9 KRUPP 0.179 15.000 10 HAPAG 0.155 13.000 Out-degree centrality
For any node, e.g. an individual or a resource, the out-links are the connections that the node of interest sends to other nodes. For example, imagine an agent by knowledge matrix then the number of out-links an agent would have is the number of pieces of knowledge it is connected to. The scientific name of this measure is out-degree and it is calculated on the agent by agent matrices. Individuals or organizations who are high in most knowledge have more expertise or are associated with more types of knowledge than are others. If no sub-network connecting agents to knowledge exists, then this measure will not be calculated. The scientific name of this measure is out degree centrality and it is calculated on agent by knowledge matrices. Individuals or organizations who are high in "most resources" have more resources or are associated with more types of resources than are others. If no sub-network connecting agents to resources exists, then this measure will not be calculated. The scientific name of this measure is out degree centrality and it is calculated on agent by resource matrices.
Input network(s): agent x agent
Rank Agent Value Unscaled 1 ALINZ 0.286 24.000 2 DEUBK 0.274 23.000 3 THYSN 0.274 23.000 4 SIEMN 0.262 22.000 5 RWE 0.238 20.000 6 DIMLR 0.202 17.000 7 VAG 0.190 16.000 8 RUHRK 0.190 16.000 9 KRUPP 0.179 15.000 10 HAPAG 0.155 13.000 Eigenvector centrality
Calculates the principal eigenvector of the network. A node is central to the extent that its neighbors are central. Leaders of strong cliques are individuals who or organizations who are collected to others that are themselves highly connected to each other. In other words, if you have a clique then the individual most connected to others in the clique and other cliques, is the leader of the clique. Individuals or organizations who are connected to many otherwise isolated individuals or organizations will have a much lower score in this measure then those that are connected to groups that have many connections themselves. The scientific name of this measure is eigenvector centrality and it is calculated on agent by agent matrices.
Input network: agent x agent (size: 15, density: 0.638095)
Rank Agent Value Unscaled Context* 1 ALINZ 0.535 0.379 -0.975 2 SIEMN 0.522 0.369 -1.035 3 THYSN 0.497 0.351 -1.147 4 DEUBK 0.486 0.344 -1.194 5 RWE 0.413 0.292 -1.523 6 DIMLR 0.407 0.288 -1.548 7 RUHRK 0.342 0.242 -1.838 8 VAG 0.322 0.228 -1.926 9 KRUPP 0.306 0.217 -1.997 10 HAPAG 0.287 0.203 -2.086 * Number of standard deviations from the mean of a random network of the same size and density
Mean: 0.337 Mean in random network: 0.754 Std.dev: 0.141 Std.dev in random network: 0.224 Eigenvector centrality per component
Calculates the principal eigenvector of the network. A node is central to the extent that its neighbors are central. Each component is extracted as a separate network, Eigenvector Centrality is computed on it and scaled according to the component size. The scores are then combined into a single result vector.
Input network(s): agent x agent
Rank Agent Value 1 ALINZ 0.353 2 SIEMN 0.344 3 THYSN 0.328 4 DEUBK 0.321 5 RWE 0.272 6 DIMLR 0.269 7 RUHRK 0.226 8 VAG 0.213 9 KRUPP 0.202 10 HAPAG 0.189 Closeness centrality
The average closeness of a node to the other nodes in a network (also called out-closeness). Loosely, Closeness is the inverse of the average distance in the network from the node to all other nodes.
Input network: agent x agent (size: 15, density: 0.638095)
Rank Agent Value Unscaled Context* 1 RUHRK 0.130 0.009 -11.459 2 DRESB 0.130 0.009 -11.459 3 HAPAG 0.128 0.009 -11.482 4 KARST 0.127 0.009 -11.504 5 ALINZ 0.126 0.009 -11.526 6 VAG 0.125 0.009 -11.548 7 RWE 0.125 0.009 -11.548 8 KREDT 0.125 0.009 -11.548 9 DIMLR 0.124 0.009 -11.570 10 KRUPP 0.124 0.009 -11.570 * Number of standard deviations from the mean of a random network of the same size and density
Mean: 0.117 Mean in random network: 0.721 Std.dev: 0.029 Std.dev in random network: 0.052 In-Closeness centrality
The average closeness of a node from the other nodes in a network. Loosely, Closeness is the inverse of the average distance in the network to the node and from all other nodes.
Input network(s): agent x agent
Rank Agent Value Unscaled 1 RUHRK 0.130 0.009 2 DRESB 0.130 0.009 3 HAPAG 0.128 0.009 4 KARST 0.127 0.009 5 ALINZ 0.126 0.009 6 VAG 0.125 0.009 7 RWE 0.125 0.009 8 KREDT 0.125 0.009 9 DIMLR 0.124 0.009 10 KRUPP 0.124 0.009 Betweenness centrality
The Betweenness Centrality of node v in a network is defined as: across all node pairs that have a shortest path containing v, the percentage that pass through v. Individuals or organizations that are potentially influential are positioned to broker connections between groups and to bring to bear the influence of one group on another or serve as a gatekeeper between groups. This agent occurs on many of the shortest paths between other agents. The scientific name of this measure is betweenness centrality and it is calculated on agent by agent matrices.
Input network: agent x agent (size: 15, density: 0.638095)
Rank Agent Value Unscaled Context* 1 RUHRK 0.147 13.421 2.384 2 DRESB 0.122 11.136 1.899 3 HAPAG 0.099 9.037 1.455 4 KARST 0.047 4.310 0.452 5 KREDT 0.047 4.242 0.438 6 ALINZ 0.022 2.033 -0.030 7 VAG 0.020 1.783 -0.083 8 DEUBK 0.018 1.625 -0.117 9 THYSN 0.014 1.262 -0.194 10 KRUPP 0.012 1.083 -0.232 * Number of standard deviations from the mean of a random network of the same size and density
Mean: 0.037 Mean in random network: 0.024 Std.dev: 0.046 Std.dev in random network: 0.052 Hub centrality
A node is hub-central to the extent that its out-links are to nodes that have many in-links. Individuals or organizations that act as hubs are sending information to a wide range of others each of whom has many others reporting to them. Technically, an agent is hub-central if its out-links are to agents that have many other agents sending links to them. The scientific name of this measure is hub centrality and it is calculated on agent by agent matrices.
Input network(s): agent x agent
Rank Agent Value 1 ALINZ 0.535 2 SIEMN 0.522 3 THYSN 0.497 4 DEUBK 0.486 5 RWE 0.413 6 DIMLR 0.407 7 RUHRK 0.342 8 VAG 0.322 9 KRUPP 0.306 10 HAPAG 0.287 Authority centrality
A node is authority-central to the extent that its in-links are from nodes that have many out-links. Individuals or organizations that act as authorities are receiving information from a wide range of others each of whom sends information to a large number of others. Technically, an agent is authority-central if its in-links are from agents that have are sending links to many others. The scientific name of this measure is authority centrality and it is calculated on agent by agent matrices.
Input network(s): agent x agent
Rank Agent Value 1 ALINZ 0.535 2 SIEMN 0.522 3 THYSN 0.497 4 DEUBK 0.486 5 RWE 0.413 6 DIMLR 0.407 7 RUHRK 0.342 8 VAG 0.322 9 KRUPP 0.306 10 HAPAG 0.287 Information centrality
Calculate the Stephenson and Zelen information centrality measure for each node.
Input network(s): agent x agent
Rank Agent Value Unscaled 1 ALINZ 0.086 10.479 2 DEUBK 0.085 10.384 3 THYSN 0.085 10.372 4 SIEMN 0.081 9.880 5 RWE 0.080 9.817 6 DIMLR 0.074 9.028 7 RUHRK 0.073 8.922 8 VAG 0.073 8.874 9 KRUPP 0.070 8.516 10 HAPAG 0.065 7.969 Clique membership count
The number of distinct cliques to which each node belongs. Individuals or organizations who are high in number of cliques are those that belong to a large number of distinct cliques. A clique is defined as a group of three or more actors that have many connections to each other and relatively fewer connections to those in other groups. The scientific name of this measure is clique count and it is calculated on the agent by agent matrices.
Input network(s): agent x agent
Rank Agent Value 1 ALINZ 12.000 2 RUHRK 11.000 3 RWE 11.000 4 DEUBK 10.000 5 VAG 9.000 6 THYSN 8.000 7 HAPAG 6.000 8 DRESB 5.000 9 KARST 5.000 10 DIMLR 4.000 Simmelian ties
The normalized number of Simmelian ties of each node.
Input network(s): agent x agent
Rank Agent Value Unscaled 1 ALINZ 0.857 12.000 2 RUHRK 0.857 12.000 3 DEUBK 0.786 11.000 4 RWE 0.786 11.000 5 THYSN 0.786 11.000 6 VAG 0.714 10.000 7 HAPAG 0.714 10.000 8 DRESB 0.714 10.000 9 DIMLR 0.643 9.000 10 KRUPP 0.643 9.000 Clustering coefficient
Measures the degree of clustering in a network by averaging the clustering coefficient of each node, which is defined as the density of the node's ego network.
Input network(s): agent x agent
Rank Agent Value 1 DIMLR 0.889 2 KRUPP 0.833 3 SIEMN 0.821 4 HAPAG 0.800 5 MANES 0.800 6 RWE 0.782 7 THYSN 0.782 8 DRESB 0.778 9 KARST 0.762 10 VAG 0.733
Key Nodes Table
This shows the top scoring nodes side-by-side for selected measures.
Rank Betweenness centrality Closeness centrality Eigenvector centrality Eigenvector centrality per component In-degree centrality In-Closeness centrality Out-degree centrality Total degree centrality 1 RUHRK RUHRK ALINZ ALINZ ALINZ RUHRK ALINZ ALINZ 2 DRESB DRESB SIEMN SIEMN DEUBK DRESB DEUBK DEUBK 3 HAPAG HAPAG THYSN THYSN THYSN HAPAG THYSN THYSN 4 KARST KARST DEUBK DEUBK SIEMN KARST SIEMN SIEMN 5 KREDT ALINZ RWE RWE RWE ALINZ RWE RWE 6 ALINZ VAG DIMLR DIMLR DIMLR VAG DIMLR DIMLR 7 VAG RWE RUHRK RUHRK VAG RWE VAG VAG 8 DEUBK KREDT VAG VAG RUHRK KREDT RUHRK RUHRK 9 THYSN DIMLR KRUPP KRUPP KRUPP DIMLR KRUPP KRUPP 10 KRUPP KRUPP HAPAG HAPAG HAPAG KRUPP HAPAG HAPAG