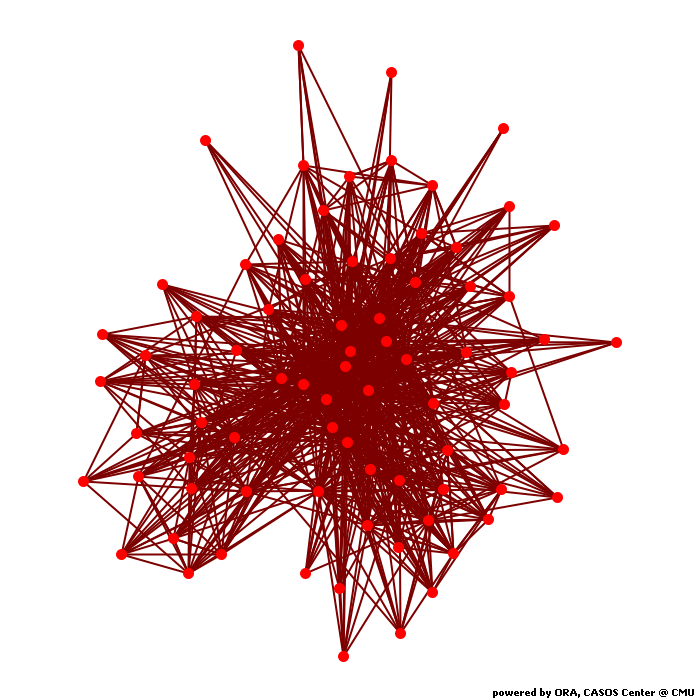
Calculates common social network measures on each selected input network.
Network test
Network Level Measures
Measure Value Row count 77.000 Column count 77.000 Link count 976.000 Density 0.165 Components of 1 node (isolates) 0 Components of 2 nodes (dyadic isolates) 0 Components of 3 or more nodes 1 Reciprocity 0.150 Characteristic path length 36139.422 Clustering coefficient 0.508 Network levels (diameter) 302507.000 Network fragmentation 0.000 Krackhardt connectedness 1.000 Krackhardt efficiency 0.729 Krackhardt hierarchy 0.569 Krackhardt upperboundedness 1.000 Degree centralization 0.037 Betweenness centralization 0.245 Closeness centralization 0.011 Eigenvector centralization 0.731 Reciprocal (symmetric)? No (14% of the links are reciprocal)
Node Level Measures
Measure Min Max Avg Stddev Total degree centrality 0.000 0.039 0.003 0.007 Total degree centrality [Unscaled] 2897.000 18478954.000 1598482.062 3192927.335 In-degree centrality 0.000 0.035 0.003 0.006 In-degree centrality [Unscaled] 1227.000 8316299.000 799251.193 1456270.366 Out-degree centrality 0.000 0.045 0.003 0.008 Out-degree centrality [Unscaled] 0.000 10604665.000 799251.196 1849219.033 Eigenvector centrality 0.000 0.790 0.078 0.141 Eigenvector centrality [Unscaled] 0.000 0.559 0.055 0.100 Eigenvector centrality per component 0.000 0.559 0.055 0.100 Closeness centrality 0.000 0.008 0.003 0.003 Closeness centrality [Unscaled] 0.000 0.000 0.000 0.000 In-Closeness centrality 0.000 0.000 0.000 0.000 In-Closeness centrality [Unscaled] 0.000 0.000 0.000 0.000 Betweenness centrality 0.000 0.263 0.021 0.043 Betweenness centrality [Unscaled] 0.000 1498.000 116.948 242.814 Hub centrality 0.000 0.646 0.064 0.148 Authority centrality 0.000 0.913 0.078 0.141 Information centrality 0.000 0.025 0.013 0.011 Information centrality [Unscaled] 0.000 9860.796 5202.858 4286.896 Clique membership count 1.000 256.000 35.117 57.967 Simmelian ties 0.000 0.237 0.039 0.062 Simmelian ties [Unscaled] 0.000 18.000 2.961 4.681 Clustering coefficient 0.157 0.820 0.508 0.170
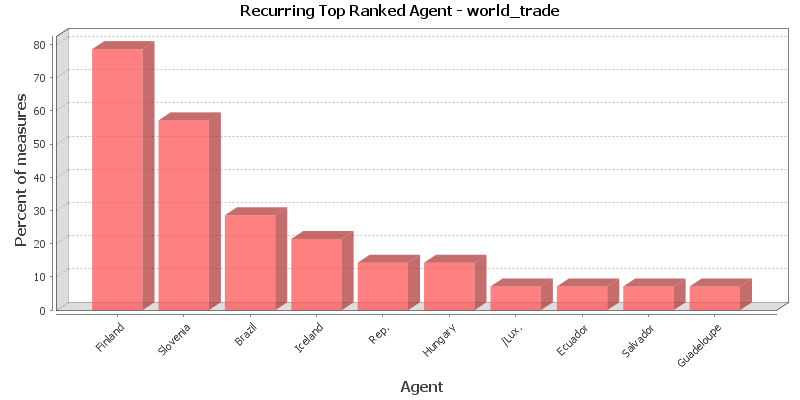
Key Nodes
This chart shows the Agent that is repeatedly top-ranked in the measures listed below. The value shown is the percentage of measures for which the Agent was ranked in the top three.
Total degree centrality
The Total Degree Centrality of a node is the normalized sum of its row and column degrees. Individuals or organizations who are "in the know" are those who are linked to many others and so, by virtue of their position have access to the ideas, thoughts, beliefs of many others. Individuals who are "in the know" are identified by degree centrality in the relevant social network. Those who are ranked high on this metrics have more connections to others in the same network. The scientific name of this measure is total degree centrality and it is calculated on the agent by agent matrices.
Input network: test (size: 77, density: 0.164615)
Rank Agent Value Unscaled Context* 1 Finland 0.039 18478954.000 -2.961 2 Slovenia 0.035 16293606.000 -3.072 3 Iceland 0.018 8397959.000 -3.471 4 Singapore 0.015 7135000.000 -3.535 5 Hungary 0.014 6767485.000 -3.553 6 Brazil 0.012 5820587.000 -3.601 7 Chile 0.011 5161290.000 -3.634 8 Kuwait 0.011 4922930.000 -3.646 9 Salvador 0.010 4584300.000 -3.663 10 Belgium 0.009 4222411.000 -3.682 * Number of standard deviations from the mean of a random network of the same size and density
Mean: 0.003 Mean in random network: 0.165 Std.dev: 0.007 Std.dev in random network: 0.042 In-degree centrality
The In Degree Centrality of a node is its normalized in-degree. For any node, e.g. an individual or a resource, the in-links are the connections that the node of interest receives from other nodes. For example, imagine an agent by knowledge matrix then the number of in-links a piece of knowledge has is the number of agents that are connected to. The scientific name of this measure is in-degree and it is calculated on the agent by agent matrices.
Input network(s): test
Rank Agent Value Unscaled 1 Slovenia 0.035 8316299.000 2 Finland 0.033 7874289.000 3 Brazil 0.016 3696907.000 4 Singapore 0.015 3601075.000 5 Kuwait 0.012 2826209.000 6 Belgium 0.011 2594610.000 7 Iceland 0.009 2107633.000 8 Germany 0.009 2099206.000 9 Hungary 0.009 2029655.000 10 Rep. 0.008 2000367.875 Out-degree centrality
For any node, e.g. an individual or a resource, the out-links are the connections that the node of interest sends to other nodes. For example, imagine an agent by knowledge matrix then the number of out-links an agent would have is the number of pieces of knowledge it is connected to. The scientific name of this measure is out-degree and it is calculated on the agent by agent matrices. Individuals or organizations who are high in most knowledge have more expertise or are associated with more types of knowledge than are others. If no sub-network connecting agents to knowledge exists, then this measure will not be calculated. The scientific name of this measure is out degree centrality and it is calculated on agent by knowledge matrices. Individuals or organizations who are high in "most resources" have more resources or are associated with more types of resources than are others. If no sub-network connecting agents to resources exists, then this measure will not be calculated. The scientific name of this measure is out degree centrality and it is calculated on agent by resource matrices.
Input network(s): test
Rank Agent Value Unscaled 1 Finland 0.045 10604665.000 2 Slovenia 0.034 7977307.000 3 Iceland 0.027 6290326.000 4 Hungary 0.020 4737830.000 5 Chile 0.017 4121729.000 6 Salvador 0.017 4095618.000 7 Singapore 0.015 3533925.000 8 Brazil 0.009 2123680.000 9 Kuwait 0.009 2096721.000 10 Rep. 0.009 2029244.125 Eigenvector centrality
Calculates the principal eigenvector of the network. A node is central to the extent that its neighbors are central. Leaders of strong cliques are individuals who or organizations who are collected to others that are themselves highly connected to each other. In other words, if you have a clique then the individual most connected to others in the clique and other cliques, is the leader of the clique. Individuals or organizations who are connected to many otherwise isolated individuals or organizations will have a much lower score in this measure then those that are connected to groups that have many connections themselves. The scientific name of this measure is eigenvector centrality and it is calculated on agent by agent matrices.
Input network: test (size: 77, density: 0.164615)
Rank Agent Value Unscaled Context* 1 Slovenia 0.790 0.559 0.757 2 Brazil 0.528 0.373 -0.191 3 Finland 0.524 0.371 -0.204 4 Iceland 0.468 0.331 -0.407 5 Chile 0.321 0.227 -0.936 6 Singapore 0.290 0.205 -1.051 7 Hungary 0.260 0.184 -1.159 8 Salvador 0.225 0.159 -1.283 9 Kuwait 0.215 0.152 -1.322 10 Rep. 0.193 0.136 -1.400 * Number of standard deviations from the mean of a random network of the same size and density
Mean: 0.078 Mean in random network: 0.581 Std.dev: 0.141 Std.dev in random network: 0.277 Eigenvector centrality per component
Calculates the principal eigenvector of the network. A node is central to the extent that its neighbors are central. Each component is extracted as a separate network, Eigenvector Centrality is computed on it and scaled according to the component size. The scores are then combined into a single result vector.
Input network(s): test
Rank Agent Value 1 Slovenia 0.559 2 Brazil 0.373 3 Finland 0.371 4 Iceland 0.331 5 Chile 0.227 6 Singapore 0.205 7 Hungary 0.184 8 Salvador 0.159 9 Kuwait 0.152 10 Rep. 0.136 Closeness centrality
The average closeness of a node to the other nodes in a network (also called out-closeness). Loosely, Closeness is the inverse of the average distance in the network from the node to all other nodes.
Input network: test (size: 77, density: 0.164615)
Rank Agent Value Unscaled Context* 1 Moldava. 0.008 0.000 -12.990 2 Finland 0.008 0.000 -12.992 3 Kuwait 0.008 0.000 -13.000 4 Hungary 0.008 0.000 -13.005 5 Chile 0.008 0.000 -13.007 6 Belgium 0.008 0.000 -13.009 7 Germany 0.008 0.000 -13.013 8 Iceland 0.007 0.000 -13.014 9 Slovenia 0.007 0.000 -13.015 10 Poland 0.007 0.000 -13.017 * Number of standard deviations from the mean of a random network of the same size and density
Mean: 0.003 Mean in random network: 0.466 Std.dev: 0.003 Std.dev in random network: 0.035 In-Closeness centrality
The average closeness of a node from the other nodes in a network. Loosely, Closeness is the inverse of the average distance in the network to the node and from all other nodes.
Input network(s): test
Rank Agent Value Unscaled 1 All nodes have this value 0.000 Betweenness centrality
The Betweenness Centrality of node v in a network is defined as: across all node pairs that have a shortest path containing v, the percentage that pass through v. Individuals or organizations that are potentially influential are positioned to broker connections between groups and to bring to bear the influence of one group on another or serve as a gatekeeper between groups. This agent occurs on many of the shortest paths between other agents. The scientific name of this measure is betweenness centrality and it is calculated on agent by agent matrices.
Input network: test (size: 77, density: 0.164615)
Rank Agent Value Unscaled Context* 1 Rep. 0.263 1498.000 19.853 2 Mexico 0.198 1126.000 14.552 3 Ecuador 0.148 842.000 10.505 4 Guiana 0.099 566.000 6.572 5 Guatemala 0.069 395.000 4.135 6 Of 0.060 344.000 3.409 7 Moldava. 0.050 286.000 2.582 8 Peru 0.049 278.000 2.468 9 Australia 0.046 261.000 2.226 10 French 0.044 253.000 2.112 * Number of standard deviations from the mean of a random network of the same size and density
Mean: 0.021 Mean in random network: 0.018 Std.dev: 0.043 Std.dev in random network: 0.012 Hub centrality
A node is hub-central to the extent that its out-links are to nodes that have many in-links. Individuals or organizations that act as hubs are sending information to a wide range of others each of whom has many others reporting to them. Technically, an agent is hub-central if its out-links are to agents that have many other agents sending links to them. The scientific name of this measure is hub centrality and it is calculated on agent by agent matrices.
Input network(s): test
Rank Agent Value 1 Iceland 0.646 2 Finland 0.638 3 Slovenia 0.626 4 Brazil 0.467 5 Chile 0.425 6 Hungary 0.311 7 Salvador 0.290 8 Singapore 0.221 9 Rep. 0.194 10 Indonesia 0.191 Authority centrality
A node is authority-central to the extent that its in-links are from nodes that have many out-links. Individuals or organizations that act as authorities are receiving information from a wide range of others each of whom sends information to a large number of others. Technically, an agent is authority-central if its in-links are from agents that have are sending links to many others. The scientific name of this measure is authority centrality and it is calculated on agent by agent matrices.
Input network(s): test
Rank Agent Value 1 Slovenia 0.913 2 Brazil 0.547 3 Finland 0.436 4 Singapore 0.342 5 Kuwait 0.282 6 Belgium 0.239 7 Germany 0.232 8 Rep. 0.220 9 Austria 0.220 10 Iceland 0.198 Information centrality
Calculate the Stephenson and Zelen information centrality measure for each node.
Input network(s): test
Rank Agent Value Unscaled 1 Finland 0.025 9860.796 2 Salvador 0.025 9858.301 3 Hungary 0.025 9856.823 4 Iceland 0.025 9853.085 5 Chile 0.025 9852.310 6 Slovenia 0.025 9849.151 7 Singapore 0.025 9836.630 8 Rep. 0.025 9819.421 9 Indonesia 0.025 9816.214 10 Austria 0.024 9812.919 Clique membership count
The number of distinct cliques to which each node belongs. Individuals or organizations who are high in number of cliques are those that belong to a large number of distinct cliques. A clique is defined as a group of three or more actors that have many connections to each other and relatively fewer connections to those in other groups. The scientific name of this measure is clique count and it is calculated on the agent by agent matrices.
Input network(s): test
Rank Agent Value 1 Finland 256.000 2 Slovenia 244.000 3 Hungary 228.000 4 Singapore 210.000 5 Iceland 166.000 6 Kuwait 127.000 7 Rep. 125.000 8 Belgium 116.000 9 Chile 113.000 10 Salvador 97.000 Simmelian ties
The normalized number of Simmelian ties of each node.
Input network(s): test
Rank Agent Value Unscaled 1 Finland 0.237 18.000 2 Rep. 0.197 15.000 3 Singapore 0.197 15.000 4 Moldava. 0.184 14.000 5 Hungary 0.171 13.000 6 Iceland 0.171 13.000 7 Slovenia 0.171 13.000 8 Austria 0.158 12.000 9 Czech 0.145 11.000 10 Belgium 0.132 10.000 Clustering coefficient
Measures the degree of clustering in a network by averaging the clustering coefficient of each node, which is defined as the density of the node's ego network.
Input network(s): test
Rank Agent Value 1 Hong 0.820 2 Israel 0.770 3 Guadeloupe 0.760 4 Mon. 0.760 5 Jordan 0.760 6 Fiji 0.750 7 Mauritius 0.730 8 Ireland 0.720 9 Martinique 0.716 10 Croatia 0.716
Key Nodes Table
This shows the top scoring nodes side-by-side for selected measures.
Rank Betweenness centrality Closeness centrality Eigenvector centrality Eigenvector centrality per component In-degree centrality In-Closeness centrality Out-degree centrality Total degree centrality 1 Rep. Moldava. Slovenia Slovenia Slovenia India Finland Finland 2 Mexico Finland Brazil Brazil Finland /Lux. Slovenia Slovenia 3 Ecuador Kuwait Finland Finland Brazil Pakistan Iceland Iceland 4 Guiana Hungary Iceland Iceland Singapore Norway Hungary Singapore 5 Guatemala Chile Chile Chile Kuwait Panama Chile Hungary 6 Of Belgium Singapore Singapore Belgium Italy Salvador Brazil 7 Moldava. Germany Hungary Hungary Iceland Barbados Singapore Chile 8 Peru Iceland Salvador Salvador Germany Korea. Brazil Kuwait 9 Australia Slovenia Kuwait Kuwait Hungary Reunion Kuwait Salvador 10 French Poland Rep. Rep. Rep. Oman Rep. Belgium