Calculates common social network measures on each selected input network.
Analysis for the Meta-Network
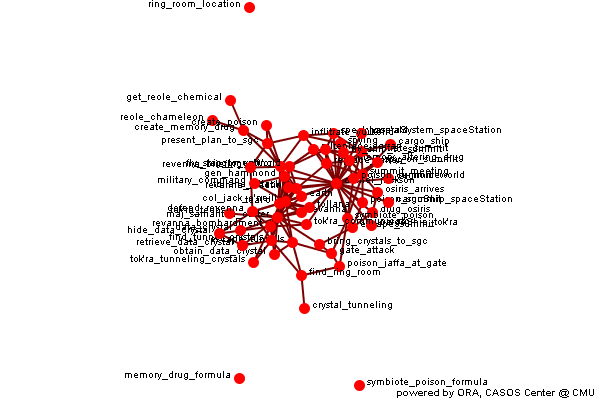
Individual entity classes have been combined into a single class, and all networks are combined to create a single network. If two networks connect the same entities, e.g. two agent x agent, then the links are combined. Link weights are made binary.
Row count 60 Column count 60 Link count 148 Density 0.04181 Isolate count 3 Component count 4 Reciprocity 0 Characteristic path length 3.872 Clustering coefficient 0.1626 Network levels (diameter) 11 Network fragmentation 0.09831 Krackhardt connectedness 0.9017 Krackhardt efficiency 0.9403 Krackhardt hierarchy 0.9341 Krackhardt upperboundedness 0.9052 Degree centralization 0.211 Betweenness centralization 0.09917 Closeness centralization 0.1109
Min Max Average Stddev Total degree centrality 0 0.2458 0.04181 0.03965 Total degree centrality (unscaled) 0 29 4.933 4.679 Eigenvector centrality 0 1 0.2424 0.2085 Hub centrality 0 1 0.1528 0.2954 Authority centrality 0 1 0.2835 0.2672 Betweenness centrality 0 0.1125 0.01494 0.02247 Betweenness centrality (unscaled) 0 384.8 51.12 76.89 Information centrality 0 0.04216 0.01667 0.0113 Information centrality (unscaled) 0 2.028 0.8019 0.5436 Clique membership count 0 26 3.167 4.994 Simmelian ties 0 0 0 0 Simmelian ties (unscaled) 0 0 0 0 Clustering coefficient 0 0.5 0.1626 0.1428 Key nodes
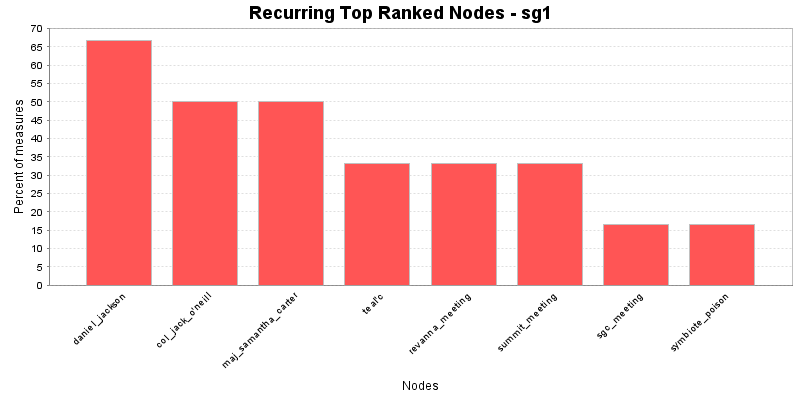
This chart shows the Nodes that repeatedly rank in the top three in the measures. The value shown is the percentage of measures for which the Nodes was ranked in the top three.
In-degree centrality
The In Degree Centrality of a node is its normalized in-degree.
Input network(s): meta-network
Rank Value Unscaled Nodes 1 0.169492 10 sgc_meeting 2 0.101695 6 revanna_meeting 3 0.101695 6 summit_meeting 4 0.101695 6 escape_tunnels 5 0.101695 6 infiltrate_summit 6 0.0847458 5 revanna_bombardment 7 0.0847458 5 earth 8 0.0847458 5 find_tunnel_crystals 9 0.0677966 4 tollana_attack 10 0.0677966 4 replace_jarren Out-degree centrality
The Out Degree Centrality of a node is its normalized out-degree.
Input network(s): meta-network
Rank Value Unscaled Nodes 1 0.491525 29 daniel_jackson 2 0.271186 16 maj_samantha_carter 3 0.220339 13 col_jack_o'neill 4 0.220339 13 teal'c 5 0.0847458 5 summit_meeting 6 0.0677966 4 gen_hammond 7 0.0677966 4 revanna_bombardment 8 0.0508475 3 spying 9 0.0508475 3 speak_gou'ald 10 0.0508475 3 infiltrate_summit Total degree centrality
The Total Degree Centrality of a node is the normalized sum of its row and column degrees.
Input network(s): meta-network
Input network size: 60
Input network density: 0.0418079
Expected value from a random network of the same size and density: 0.0418079
Rank Value Unscaled Nodes Context* 1 0.245763 29 daniel_jackson 7.89322 2 0.135593 16 col_jack_o'neill 3.62957 3 0.135593 16 maj_samantha_carter 3.62957 4 0.110169 13 teal'c 2.64565 5 0.0932203 11 summit_meeting 1.9897 6 0.0932203 11 sgc_meeting 1.9897 7 0.0762712 9 revanna_bombardment 1.33376 8 0.0762712 9 infiltrate_summit 1.33376 9 0.0677966 8 revanna_meeting 1.00578 10 0.059322 7 gen_hammond 0.677811 * Number of standard deviations from the mean if links were distributed randomly Mean: 0.0418079 Std.dev: 0.0258392 Eigenvector centrality
Calculates the principal eigenvector of the network. A node is central to the extent that its neighbors are central.
Input network(s): meta-network
Input network size: 60
Input network density: 0.0418079
Expected value from a random network of the same size and density: 0.614044
Rank Value Nodes Context* 1 1 daniel_jackson 1.46462 2 0.874183 col_jack_o'neill 0.987169 3 0.684846 teal'c 0.268679 4 0.659709 maj_samantha_carter 0.173289 5 0.609425 sgc_meeting -0.0175247 6 0.569852 revanna_meeting -0.167695 7 0.457745 gen_hammond -0.593118 8 0.445898 tollana_attack -0.638076 9 0.441074 revanna_bombardment -0.656379 10 0.42823 earth -0.705119 * Number of standard deviations from the mean if links were distributed randomly Mean: 0.614044 Std.dev: 0.26352 Betweenness centrality
The Betweenness Centrality of node v in a network is defined as: across all node pairs that have a shortest path containing v, the percentage that pass through v.
Input network(s): meta-network
Input network size: 60
Input network density: 0.0418079
Expected value from a random network of the same size and density: 0.0427676
Rank Value Unscaled Nodes Context* 1 0.112459 384.833 summit_meeting 0.348553 2 0.0696717 238.417 revanna_meeting 0.134559 3 0.0632915 216.583 symbiote_poison 0.102648 4 0.0580314 198.583 gate_attack 0.0763403 5 0.051164 175.083 escape_tunnels 0.0419939 6 0.0508475 174 poison_summit 0.0404106 7 0.0506526 173.333 replace_jarren 0.0394362 8 0.0474868 162.5 sgc_meeting 0.0236028 9 0.0402299 137.667 find_tunnel_crystals -0.0126923 10 0.0344341 117.833 memory_altering_drug -0.0416797 * Number of standard deviations from the mean if links were distributed randomly Mean: 0.0427676 Std.dev: 0.199943 Closeness centrality
The average closeness of a node to the other nodes in a network. Loosely, Closeness is the inverse of the average distance in the network between the node and all other nodes.
Input network(s): meta-network
Input network size: 60
Input network density: 0.0418079
Expected value from a random network of the same size and density: 0.0921591
Rank Value Unscaled Nodes Context* 1 0.080163 0.0013587 daniel_jackson -0.420533 2 0.0501274 0.000849618 maj_samantha_carter -1.47346 3 0.047812 0.000810373 teal'c -1.55463 4 0.0456656 0.000773994 col_jack_o'neill -1.62987 5 0.0372475 0.000631313 gen_hammond -1.92498 6 0.0364198 0.000617284 speak_gou'ald -1.95399 7 0.0363077 0.000615385 spying -1.95792 8 0.0353082 0.000598444 inflitrate_yuWorld -1.99296 9 0.0352029 0.000596659 reole_chameleon -1.99665 10 0.0352029 0.000596659 get_reole_chemical -1.99665 * Number of standard deviations from the mean if links were distributed randomly Mean: 0.0921591 Std.dev: 0.0285259