Calculates common social network measures on each selected input network.
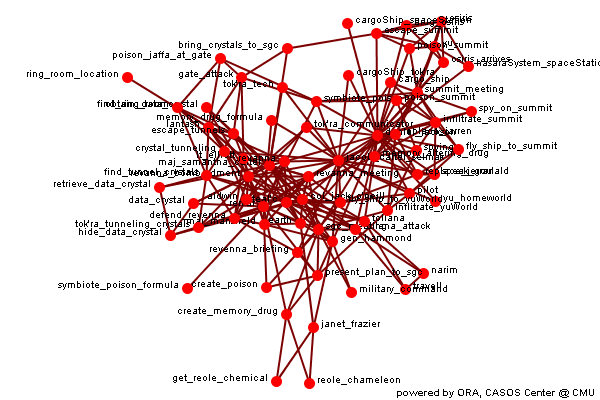
Analysis for the Meta-Network
Individual entity classes have been combined into a single class, and all networks are combined to create a single network. If two networks connect the same entities, e.g. two agent x agent, then the links are combined. Link weights are made binary.
Row count 71 Column count 71 Link count 243 Density 0.04889 Isolate count 0 Component count 1 Reciprocity 0.008299 Characteristic path length 3.653 Clustering coefficient 0.1781 Network levels (diameter) 11 Network fragmentation 0 Krackhardt connectedness 1 Krackhardt efficiency 0.9292 Krackhardt hierarchy 0.9514 Krackhardt upperboundedness 0.8261 Degree centralization 0.1628 Betweenness centralization 0.08434 Closeness centralization 0.05079
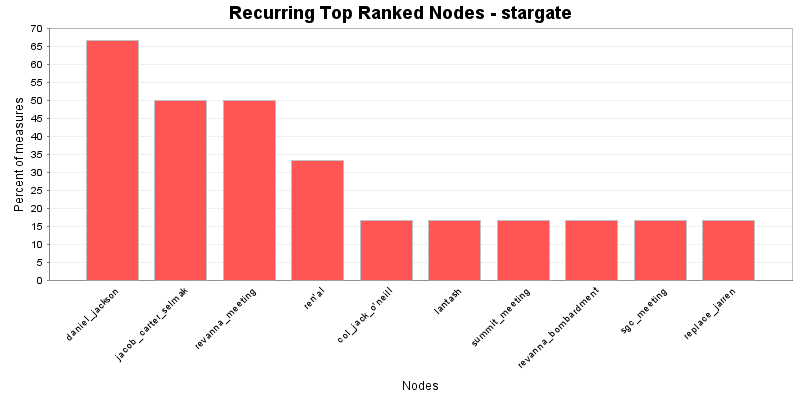
Min Max Average Stddev Total degree centrality 0.007143 0.2071 0.04889 0.03638 Total degree centrality (unscaled) 1 29 6.845 5.093 Eigenvector centrality 0.03011 1 0.3277 0.2417 Hub centrality 0 1 0.1316 0.2281 Authority centrality 0 1 0.2418 0.234 Betweenness centrality 0 0.09451 0.01136 0.01847 Betweenness centrality (unscaled) 0 456.5 54.86 89.2 Information centrality 0 0.03179 0.01408 0.009164 Information centrality (unscaled) 0 2.223 0.985 0.6409 Clique membership count 0 26 4.93 5.478 Simmelian ties 0 0 0 0 Simmelian ties (unscaled) 0 0 0 0 Clustering coefficient 0 0.5 0.1781 0.125 Key nodes
This chart shows the Nodes that repeatedly rank in the top three in the measures. The value shown is the percentage of measures for which the Nodes was ranked in the top three.
In-degree centrality
The In Degree Centrality of a node is its normalized in-degree.
Input network(s): meta-network
Rank Value Unscaled Nodes 1 0.157143 11 revanna_meeting 2 0.157143 11 revanna_bombardment 3 0.157143 11 sgc_meeting 4 0.142857 10 revanna 5 0.128571 9 earth 6 0.114286 8 summit_meeting 7 0.114286 8 escape_tunnels 8 0.114286 8 defend_revenna 9 0.0857143 6 gen_hammond 10 0.0857143 6 tollana_attack Out-degree centrality
The Out Degree Centrality of a node is its normalized out-degree.
Input network(s): meta-network
Rank Value Unscaled Nodes 1 0.414286 29 daniel_jackson 2 0.3 21 jacob_carter_selmak 3 0.242857 17 ren'al 4 0.228571 16 maj_samantha_carter 5 0.185714 13 col_jack_o'neill 6 0.185714 13 teal'c 7 0.157143 11 lantash 8 0.128571 9 lt_elliott 9 0.114286 8 aldwin 10 0.1 7 osiris Total degree centrality
The Total Degree Centrality of a node is the normalized sum of its row and column degrees.
Input network(s): meta-network
Input network size: 71
Input network density: 0.0488934
Expected value from a random network of the same size and density: 0.0488934
Rank Value Unscaled Nodes Context* 1 0.207143 29 daniel_jackson 6.18347 2 0.15 21 jacob_carter_selmak 3.95066 3 0.142857 20 ren'al 3.67156 4 0.114286 16 col_jack_o'neill 2.55515 5 0.114286 16 maj_samantha_carter 2.55515 6 0.107143 15 revanna_bombardment 2.27605 7 0.0928571 13 teal'c 1.71785 8 0.0928571 13 revanna_meeting 1.71785 9 0.0928571 13 summit_meeting 1.71785 10 0.0857143 12 lantash 1.43875 * Number of standard deviations from the mean if links were distributed randomly Mean: 0.0488934 Std.dev: 0.0255924 Eigenvector centrality
Calculates the principal eigenvector of the network. A node is central to the extent that its neighbors are central.
Input network(s): meta-network
Input network size: 71
Input network density: 0.0488934
Expected value from a random network of the same size and density: 0.424554
Rank Value Nodes Context* 1 1 daniel_jackson 2.38739 2 0.941895 col_jack_o'neill 2.14632 3 0.878546 revanna_meeting 1.8835 4 0.846751 ren'al 1.75159 5 0.837472 revanna_bombardment 1.7131 6 0.791846 jacob_carter_selmak 1.52381 7 0.771845 teal'c 1.44083 8 0.750954 maj_samantha_carter 1.35415 9 0.699122 sgc_meeting 1.13912 10 0.686179 revanna 1.08542 * Number of standard deviations from the mean if links were distributed randomly Mean: 0.424554 Std.dev: 0.241036 Betweenness centrality
The Betweenness Centrality of node v in a network is defined as: across all node pairs that have a shortest path containing v, the percentage that pass through v.
Input network(s): meta-network
Input network size: 71
Input network density: 0.0488934
Expected value from a random network of the same size and density: 0.0335015
Rank Value Unscaled Nodes Context* 1 0.0945135 456.5 summit_meeting 0.261785 2 0.0721498 348.483 revanna_meeting 0.165829 3 0.0524293 253.233 replace_jarren 0.0812136 4 0.0502726 242.817 symbiote_poison 0.07196 5 0.0494134 238.667 sgc_meeting 0.0682733 6 0.0435714 210.45 gate_attack 0.0432071 7 0.0379055 183.083 escape_tunnels 0.018896 8 0.0369358 178.4 poison_summit 0.0147356 9 0.0335059 161.833 revanna_bombardment 1.86535e-005 10 0.0327536 158.2 memory_altering_drug -0.00320901 * Number of standard deviations from the mean if links were distributed randomly Mean: 0.0335015 Std.dev: 0.233061 Closeness centrality
The average closeness of a node to the other nodes in a network. Loosely, Closeness is the inverse of the average distance in the network between the node and all other nodes.
Input network(s): meta-network
Input network size: 71
Input network density: 0.0488934
Expected value from a random network of the same size and density: 0.214918
Rank Value Unscaled Nodes Context* 1 0.0462963 0.000661376 jacob_carter_selmak -3.78079 2 0.042735 0.000610501 daniel_jackson -3.86064 3 0.0384827 0.000549753 lantash -3.95598 4 0.0383562 0.000547945 lt_elliott -3.95882 5 0.0324675 0.000463822 maj_samantha_carter -4.09085 6 0.0324074 0.000462963 aldwin -4.0922 7 0.0316313 0.000451875 ren'al -4.1096 8 0.0314748 0.00044964 teal'c -4.11311 9 0.0305277 0.00043611 col_jack_o'neill -4.13435 10 0.0293624 0.000419463 janet_frazier -4.16047 * Number of standard deviations from the mean if links were distributed randomly Mean: 0.214918 Std.dev: 0.0445995