
Event Detection from Twitter using Hierarchical Bayesian Models
Overview | People | Collaborators | Sponsors | Publications | Tools
Introductions
Online social networks like Twitter and Facebook produce an overwhelming amount of information every day. However, research suggests that much of this content focuses on a reasonably sized set of ongoing events or topics that are both temporally and geographically situated. These patterns are especially observable when the data that is generated contains geospatial information, usually generated by a location-enabled device such as a smartphone. In this project, we consider a data set of 1.4 million geo-tagged tweets from a country during a large social movement, where social events and demonstrations occurred frequently. We use a probabilistic graphical model to discover these events within the data in a way that informs us of their spatial, temporal and topical focus. Quantitative analysis suggests that the streaming algorithm proposed in the project uncovers both well-known events and lesser-known but important events that occurred within the timeframe of the dataset. In addition, the model can be used to predict the location and time of texts that do not have these pieces of information, which accounts for the much of the data on the web.
Qualitative Analysis
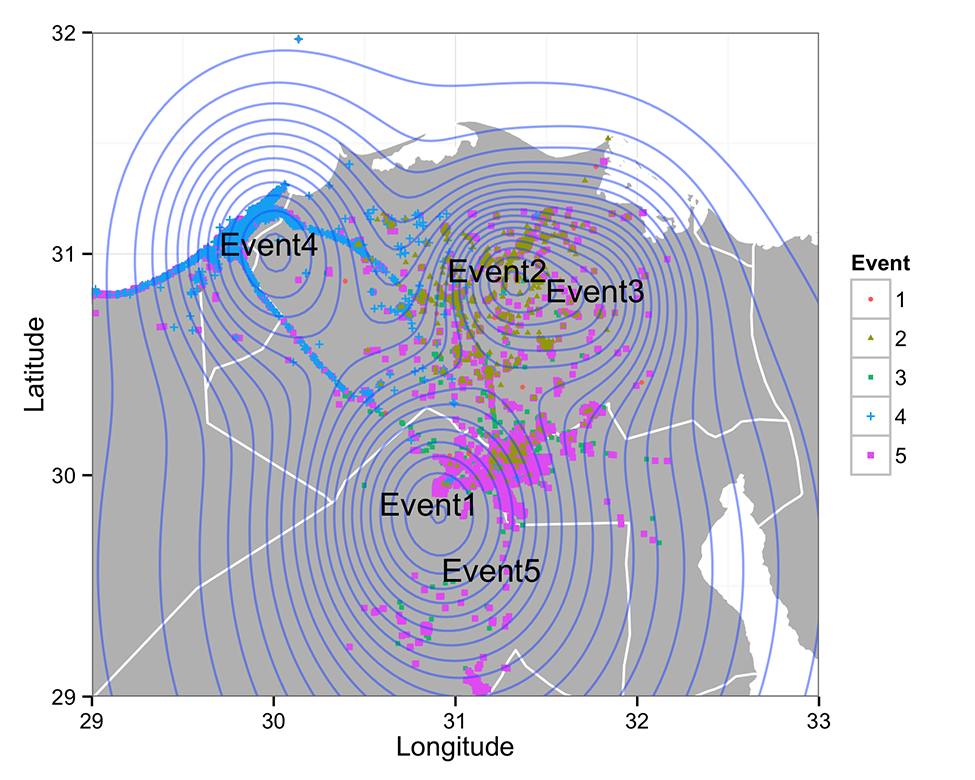
The spatial distribution of the five events is illustrated in Figure 1, where each point represents a tweet and a particular event being ascribed to by the color and shape. The figure displays up to 20,000 randomly sampled tweets that the model associated with these five events. Figure 1 also overlays a contour graph for all points in the graph. The contour plot is constructed using a mixture Gaussian distribution. To construct such a mixture Gaussian distribution, we use ? to serve as the mixture weight and use the event geographical centers and deviations for each Gaussian component. The result is a single distribution on a two-dimensional space that represents latitude and longitude. Curved circles in the contour plot represent the probability density of the distribution. Regions with multiple such curves are the ones that have steep change in their mixture Gaussian distributions. The contour plot shows three clear geographical clusters, which correspond to three large cities in Egypt: Alexandria (left), Cairo (bottom right) and El-Mahalla El- Kubra (top right). As is also clear, certain events are located within the same cities. Without the temporal and lexical dimensions of the model, it would thus be difficult to discern differences between these events. However, exploring these distributions makes it relatively easy to observe the very different focus of each of these sets of tweets.
 Figures 1 & 2
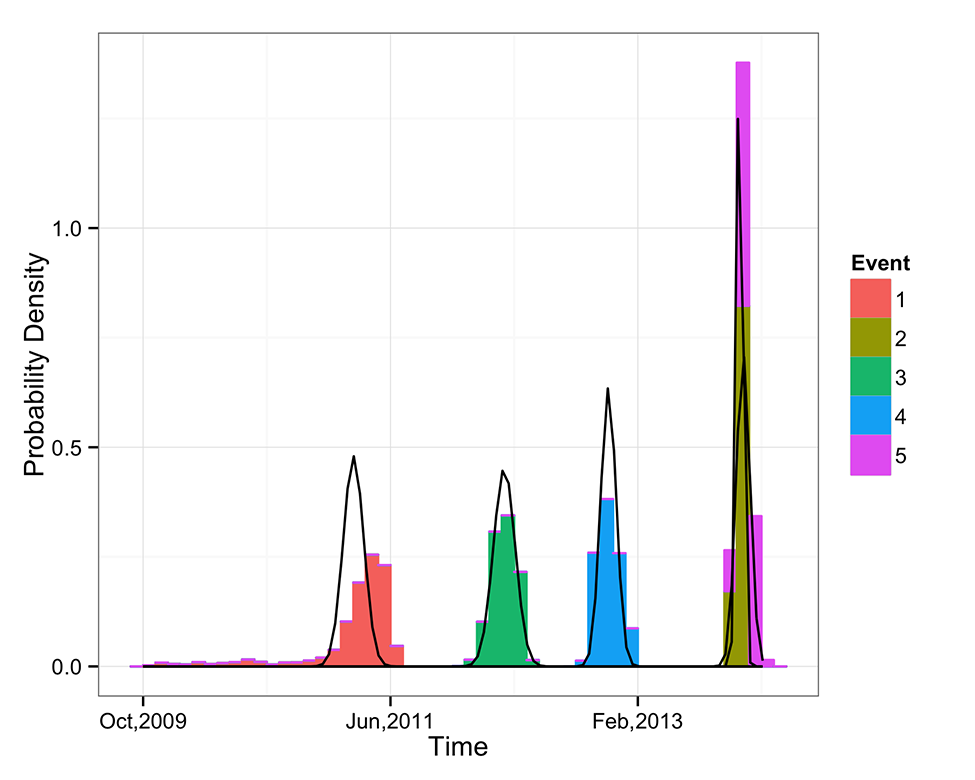
Figure 2 displays the temporal distributions of the five events of interest. Though we have analyzed each event independently in validating the model, we focus here on the most relevant event, labeled Event 1(E1). This events tweets were heavily centered in Cairo and took place during the earlier portion of 2011. Without considering the topical focus of the event, these clues suggest that it corresponds to the initial protests that spurred the rapid spread of the social movement generally referred to as the Arab Spring. The protests were held largely in Tahrir Square, located within Cairo. Additionally, the central date associated with the protests was January 25 and start from January 28 the government started to force the protestors to leave. Nevertheless, the main protest lasted for approximately three weeks with continuous demonstrations continued after that. The models inferred start date for Event 1 was January 30th, extending to an end date of March 21st.
Table 1: Top words for each event
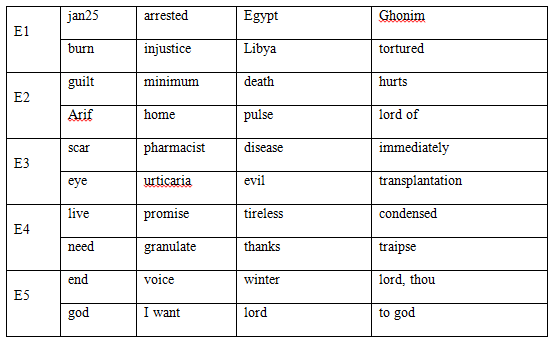
The topic for Event 1 in the event category in Table 1 supports the idea that Event 1 uncovers the protests in Tahrir Square. Here we see words such 'burn', 'arrested', 'honor', 'injustice', 'tortured', all of which match what we would expect to have seen and have expected to be protested during the demonstrations. Indeed, the focal date of the protests occurred on January 25 and we correspondingly observe that the popular term 'jan25' appear frequently in our data set. The most representative words in Event 1s topic also include the name 'ghonim', referring to the activist Wael Ghonim who played a central role in the protests.
While we focus here on Event 1, we note that the other events in our dataset do appear to have a qualitative realization in the real world. For example, Event 3 describes a (comparatively) minor event related to an outbreak of hand and foot disease in Egypt around February of 2012.
Quantitative Analysis
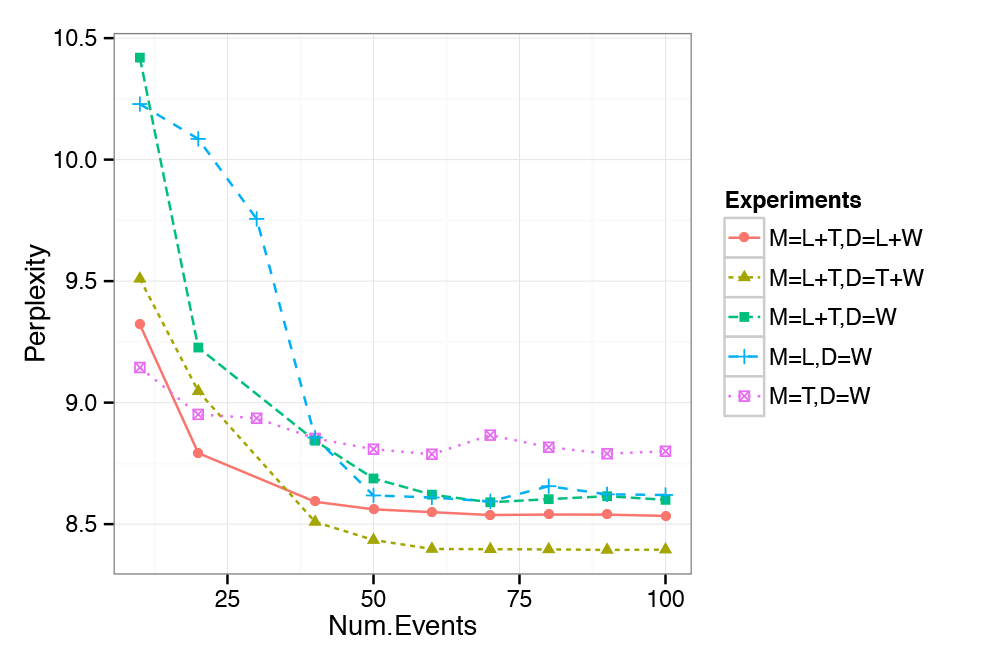
Experimental results for perplexity are illustrated in Figure 3, where each colored line represents a different model/test data combination. For example, lines marked with 'M=L+T,D=L+W' represent the results with Model M=L+T trained on a data set where both location and text information are given for training while 'M=L+T,D=W' represents the same model where only text is given during training. On the x-axis we vary the number of events the model is trained with. Two important observations can be made about the plot. First, the figure shows that up to a point, model performance improves with an increasing number of events regardless of the model and test data used. When the number of events becomes large enough (e.g. 50) the decrease in perplexity is not as substantial as before, suggesting that the number of events is large enough to capture the major event information in our data set. Second, and more importantly, Figure 3 shows that the full model performs significantly better than all other models when given temporal information about the test data and when trained with a large enough number of events.
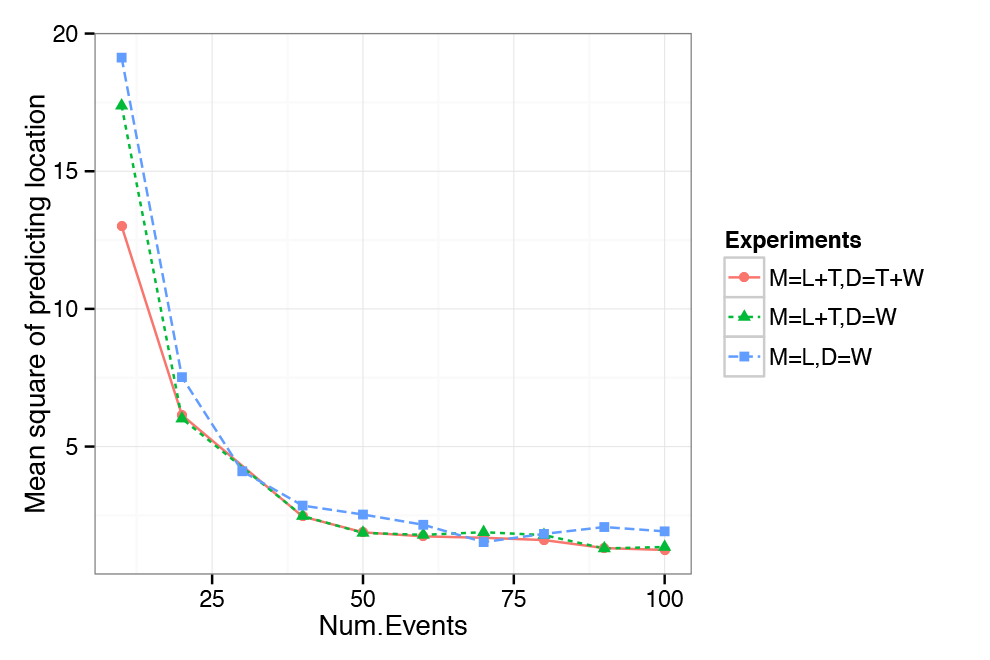
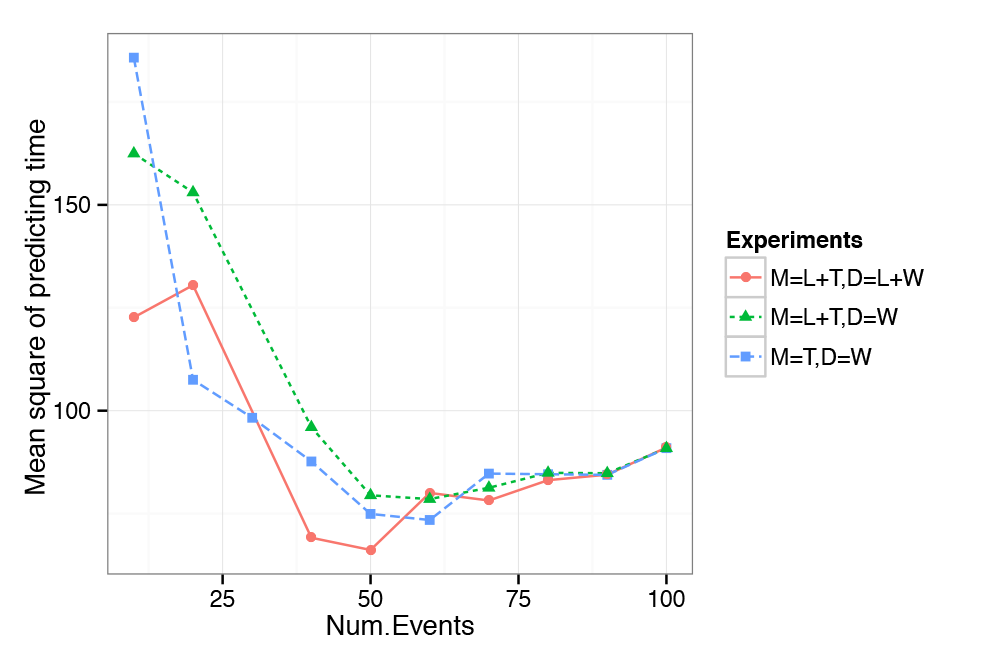
The prediction of location and time shows similar pattern to perplexity, indicating that with the optimal number of events approaches, the full model given the information we are not predicting (i.e. given location when predicting time and time when predicting location) performs better than the alternative models and without this information. This is illustrated in Figure 4 and Figure 5. Results thus indicate that the model is able to make good use of the provided information and improves on models that do not take into account location or time.
 Figures 3, 4, & 5
Conclusion
In this project we proposed a probabilistic graphical model to discover latent events that are clustered in the spatial, temporal and lexical dimensions. Both the qualitative analysis and quantitative analysis we present justified our model on a large Twitter data set. Results show that our model improved over baseline approaches on a variety of prediction tasks. These qualitative efforts show that our work can be used in a variety of application areas where event extraction and location/time prediction of social media data is of interest, like in the detection of protests and demonstrations as shown here but also in detecting, for example, important local sporting events that may be relevant to different users.
There are several ways in which the present work can be further extended. First, both location and time are converted into an index through an evenly distributed selection function. There may be better approaches in cases where geo- temporal distributions are uneven, as is frequently the case in real-world data. Second, a control on granularity of the event should be added so that when tweaking the granularity of the variables, one can generate (or discover) events that are more localized or globalized. Finally, the assumption that spatial and temporal related topics is allocated on a evenly-spaced grid requires further investigation. One immediate solution is to use techniques such as k-d tree to generate topics on regions of different sizes.