Calculates common social network measures on each selected input network.
Analysis for the Meta-Network
Individual entity classes have been combined into a single class, and all networks are combined to create a single network. If two networks connect the same entities, e.g. two agent x agent, then the links are combined. Link weights are made binary.
Row count 34 Column count 34 Link count 156 Density 0.139 Isolate count 0 Component count 1 Reciprocity 1 Characteristic path length 2.408 Clustering coefficient 0.5706 Network levels (diameter) 5 Network fragmentation 0 Krackhardt connectedness 1 Krackhardt efficiency 0.9148 Krackhardt hierarchy 0 Krackhardt upperboundedness 1 Degree centralization 0.3996 Betweenness centralization 0.4056 Closeness centralization 0.2982
Min Max Average Stddev Total degree centrality 0.0303 0.5152 0.139 0.1158 Total degree centrality (unscaled) 2 34 9.176 7.641 Eigenvector centrality 0.0633 1 0.3921 0.2392 Hub centrality 0.0633 1 0.3921 0.2392 Authority centrality 0.0633 1 0.3921 0.2392 Betweenness centrality 0 0.4376 0.04401 0.09254 Betweenness centrality (unscaled) 0 462.1 46.47 97.73 Information centrality 0.01557 0.04521 0.02941 0.007479 Information centrality (unscaled) 0.6928 2.012 1.309 0.3329 Clique membership count 0 11 2.382 2.712 Simmelian ties 0 0.4242 0.1194 0.1026 Simmelian ties (unscaled) 0 14 3.941 3.386 Clustering coefficient 0 1 0.5706 0.3423 Key nodes
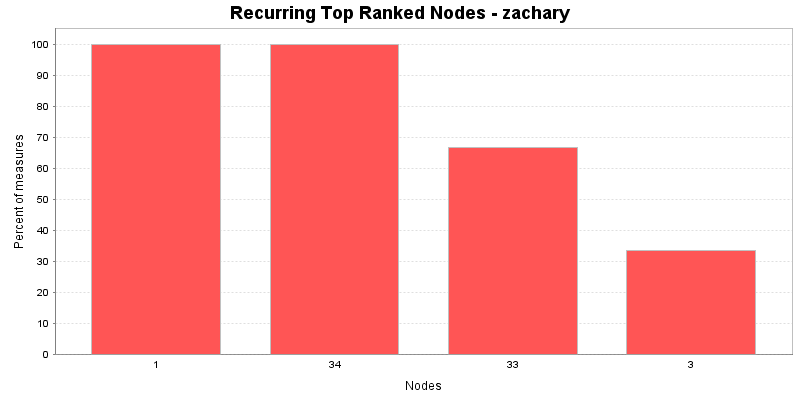
This chart shows the Nodes that repeatedly rank in the top three in the measures. The value shown is the percentage of measures for which the Nodes was ranked in the top three.
In-degree centrality
The In Degree Centrality of a node is its normalized in-degree.
Input network(s): meta-network
Rank Value Unscaled Nodes 1 0.515152 17 34 2 0.484848 16 1 3 0.363636 12 33 4 0.30303 10 3 5 0.272727 9 2 6 0.181818 6 4 7 0.181818 6 32 8 0.151515 5 9 9 0.151515 5 14 10 0.151515 5 24 Out-degree centrality
The Out Degree Centrality of a node is its normalized out-degree.
Input network(s): meta-network
Rank Value Unscaled Nodes 1 0.515152 17 34 2 0.484848 16 1 3 0.363636 12 33 4 0.30303 10 3 5 0.272727 9 2 6 0.181818 6 4 7 0.181818 6 32 8 0.151515 5 9 9 0.151515 5 14 10 0.151515 5 24 Total degree centrality
The Total Degree Centrality of a node is the normalized sum of its row and column degrees.
Input network(s): meta-network
Input network size: 34
Input network density: 0.139037
Expected value from a random network of the same size and density: 0.139037
Rank Value Unscaled Nodes Context* 1 0.515152 34 34 6.33871 2 0.484848 32 1 5.82801 3 0.363636 24 33 3.7852 4 0.30303 20 3 2.7638 5 0.272727 18 2 2.2531 6 0.181818 12 4 0.720991 7 0.181818 12 32 0.720991 8 0.151515 10 9 0.210289 9 0.151515 10 14 0.210289 10 0.151515 10 24 0.210289 * Number of standard deviations from the mean if links were distributed randomly Mean: 0.139037 Std.dev: 0.059336 Eigenvector centrality
Calculates the principal eigenvector of the network. A node is central to the extent that its neighbors are central.
Input network(s): meta-network
Input network size: 34
Input network density: 0.139037
Expected value from a random network of the same size and density: 0.465773
Rank Value Nodes Context* 1 1 34 1.92204 2 0.952132 1 1.74982 3 0.849554 3 1.38077 4 0.826659 33 1.2984 5 0.712335 2 0.887079 6 0.609069 9 0.515548 7 0.606574 14 0.506575 8 0.565614 4 0.359208 9 0.511657 32 0.165079 10 0.468065 31 0.00824511 * Number of standard deviations from the mean if links were distributed randomly Mean: 0.465773 Std.dev: 0.277948 Betweenness centrality
The Betweenness Centrality of node v in a network is defined as: across all node pairs that have a shortest path containing v, the percentage that pass through v.
Input network(s): meta-network
Input network size: 34
Input network density: 0.139037
Expected value from a random network of the same size and density: 0.0498446
Rank Value Unscaled Nodes Context* 1 0.437635 462.143 1 11.1763 2 0.304075 321.103 34 7.32702 3 0.145247 153.381 33 2.74954 4 0.143657 151.702 3 2.7037 5 0.138276 146.019 32 2.54862 6 0.0559268 59.0587 9 0.175293 7 0.0539367 56.9571 2 0.117936 8 0.0458634 48.4317 14 -0.114739 9 0.0324751 34.2937 20 -0.500596 10 0.0299874 31.6667 6 -0.572292 * Number of standard deviations from the mean if links were distributed randomly Mean: 0.0498446 Std.dev: 0.0346977 Closeness centrality
The average closeness of a node to the other nodes in a network. Loosely, Closeness is the inverse of the average distance in the network between the node and all other nodes.
Input network(s): meta-network
Input network size: 34
Input network density: 0.139037
Expected value from a random network of the same size and density: 0.381281
Rank Value Unscaled Nodes Context* 1 0.568965 0.0172414 1 3.06363 2 0.559322 0.0169492 3 2.90621 3 0.55 0.0166667 34 2.75405 4 0.540984 0.0163934 32 2.60687 5 0.515625 0.015625 9 2.19293 6 0.515625 0.015625 14 2.19293 7 0.515625 0.015625 33 2.19293 8 0.5 0.0151515 20 1.93788 9 0.485294 0.0147059 2 1.69783 10 0.464789 0.0140845 4 1.36312 * Number of standard deviations from the mean if links were distributed randomly Mean: 0.381281 Std.dev: 0.0612621